Download
1 / 21
210 likes | 356 Views
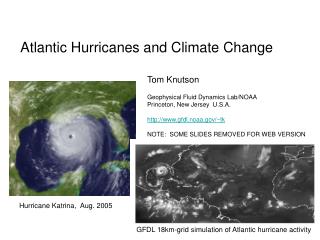
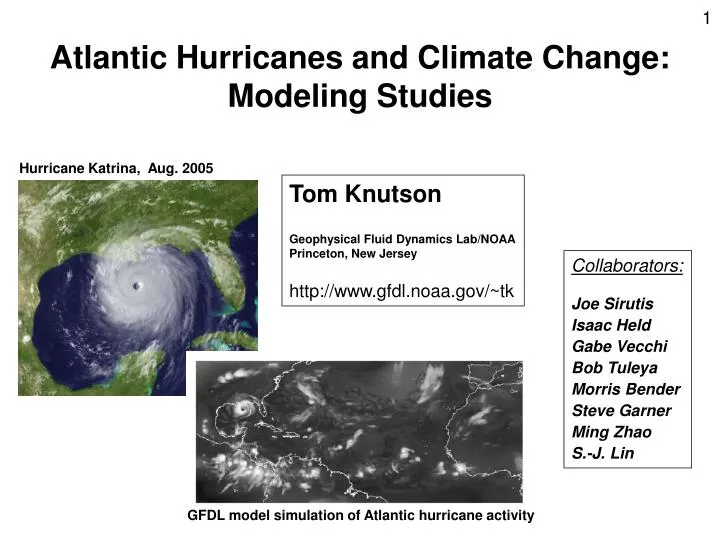
Atlantic Hurricanes and Climate Change: Modeling Studies. 1. Hurricane Katrina, Aug. 2005. Tom Knutson Geophysical Fluid Dynamics Lab/NOAA Princeton, New Jersey http://www.gfdl.noaa.gov/~tk. Collaborators: Joe Sirutis Isaac Held Gabe Vecchi Bob Tuleya Morris Bender Steve Garner

E N D
Atlantic Hurricanes and Climate Change: Modeling Studies 1 Hurricane Katrina, Aug. 2005 Tom Knutson Geophysical Fluid Dynamics Lab/NOAA Princeton, New Jersey http://www.gfdl.noaa.gov/~tk Collaborators: Joe Sirutis Isaac Held Gabe Vecchi Bob Tuleya Morris Bender Steve Garner Ming Zhao S.-J. Lin GFDL model simulation of Atlantic hurricane activity
Statistical projections of 21st century Atlantic hurricane activity have a large dependence on the predictor used. • Projection 1: Absolute SST • ~300% projected increase in • Power Dissipation • Indirect attribution: • CO2 SST Hurricanes • Projection 2: Relative SST • Projected change: • sign uncertain, +/- 80% • No Attribution Source: Vecchi et al. Science (2008)
3 Zetac Regional Model reproduces the interannual variability and trend of Atlantic hurricane counts (1980-2006) 18-km grid model nudged toward large-scale (wave 0-2) NCEP Reanalyses Source: Knutson et al., 2007, Bull. Amer. Meteor. Soc.
Higher shear Projected Atlantic region climate changes: 18-Model CMIP3 ensemble Higher potential intensity
5 The model provides projections of Atlantic hurricane and tropical storm frequency changes for late 21st century, downscaled from a multi-model ensemble climate change (IPCC A1B scenario): 1) Decreased frequency of tropical storms (-27%) and hurricanes (-18%). Storm Intensities(Normalized by frequency) 2) Increased frequency and intensity of the strongest hurricanes (5 12) 4) A more consistent intensity increase is apparent after adjusting for decreased frequency 3) Caveat: this model does not simulate hurricanes as strong as those observed. Source: Knutson et al., 2008, Nature Geoscience.
Zetac Model Downscaling: • 9 individual CMIP3 models now completed • (plus the 18-model ensemble mean) • A consistent decrease in tropical storms becomes a mixture of decreases and increases for major (Cat 3) hurricanes (in terms of central pressure) Provisional Results: Do not quote or cite.
Tropical Cyclones Frequency Projections (Late 21st century) - Summary Blue = decrease Red = increase Source: Knutson et al. 2010
8 The new model simulates increased hurricane rainfall rates in the warmer climate (late 21st century, A1B scenario) …consistent with previous studies… Present Climate Warm Climate Rainfall Rates (mm/day) Warm Climate – Present Climate Avg. Rainfall Rate Increases: 50 km radius: +37% 100 km radius: +23% 150 km radius: +17% 400 km radius: +10% Average Warming: 1.72oC Source: Knutson et al., 2008, Nature Geoscience.
A further downscaling step to 9-km triply nested GFDL hurricane modelMorris Bender, et al., Science, Feb. 2010.
Down-scaled GFDL hurricane prediction model produced much more realistic distribution of maximum wind speeds compared to Zetac. 35 Simulated distributions of maximum wind speeds (Atlantic tropical storms and hurricanes, 1980-2006) Normalized occurrences 18km grid Zetac regional climate model 9 km GFDL hurricane model observed 20 30 40 50 60 70 80 Maximum Wind Speed (m/s) Source: Bender, et al., Science, 2010.
Observed intensities Distributions (CDF’s) of Atlantic tropical cyclone intensities (1980-2006). Red: 1980-1994 (inactive) Blue: 1995-2006 (active) Fraction of storms above indicated intensity Active era Inactive era Simulated intensities Fraction of storms above indicated intensity GFDL Hurricane Model intensity distribution is also shifted to higher intensities in active years, but the difference is smaller than observed. Active era Inactive era Source: Bender et al., Science, 2010. Maximum Wind Speed (m/s)
In a warmer climate (late 21st century A1B scenario) the hurricane model simulates an expanded distribution of Atlantic hurricane intensities. 12 Control The strongest hurricanes increase in number for the downscaled ensemble-mean climate warming… …and increase for 3 of 4 individual climate models tested. Source: Bender et al., Science, 2010.
Late 21st Century Climate Warming Projection-- Average of 18 CMIP3 Models (27 Simulated Hurricane Seasons) Source: Bender et al., Science, 2010
Tracks of Storms that Reached Category 4 or 5 Intensity Degrees Latitude NWS VERSION (GFDL) Late 21st Century Warmed Climate Projection based on 4 Individual CMIP3 Climate Models Control Climate (Odd Years Only) Degrees Longitude East Degrees Latitude MPI-ECHAM5 GFDL-CM2.1 MRI-CGCM UKMO-HADCM3 Degrees Longitude East Degrees Longitude East
SUMMARY OF PROJECTED CHANGE Cat 4+5 frequency: 81% increase, or 10% per decade Estimated net impact of these changes on damage potential: +28% • Colored bars show changes for the18 model CMIP3 ensemble (27 seasons); dots show range of changes across 4 individual CMIP models (13 seasons). Source: Bender et al., Science, 2010.
Emergence Time Scale: If the observed Cat 4+5 data since 1944 represents the noise (e.g. through bootstrap resampling), how long would it take for a trend of ~10% per decade in Cat 4+5 frequency to emerge from noise? Answer: ~60 yr (by then 95% of cases are positive) Instead, assume residuals from a 4th order polynomial: 55 yr Instead, resample chunks of length 3-7 yr: 65-70 yr Source: Bender et al., Science, 2010.
GFDL HIRAM 50km grid global model: Simulated vs Observed Tropical Storm Tracks (1981-2005) Source: Zhao et al. J. Climate (2009)
North Atlantic HIRAM 50 km grid model TC correlations for several basins corr=0.83 red: observations blue: HiRAM ensemble mean shading: model uncertainty East Pacific corr=0.62 Hurricane counts for each basin are normalized by a time-independent multiplicative factor West Pacific corr=0.52 Correlation for the South Pacific is ~0.3 and insignificant for the Indian Ocean Source: Zhao, Held, Lin, and Vecchi (J. Climate, 2009)
Projected Changes in Regional Hurricane Activity GFDL 50-km HIRAM, using four projections of late 21st Century SSTs. 18-model CMIP3 Ensemble GFDL CM2.1 HadCM3 ECHAM5 Red/yellow = increase Blue/green = decrease Unit: Number per year • Regional increases/decreases much larger than global-mean. • Pattern depends on details of SST change. Source: Zhao, Held, Lin and Vecchi (J. Climate, 2009)
Global Model Tropical Cyclone Climate Change Experiments: Use A1B Scenario late 21st century projected SST changes from several CMIP3 models HadCM3 GFDL CM2.1 ECHAM5 CMIP3 18-model Ensemble Unit: Deg C Source: Zhao, Held, Lin, and Vecchi (J. Climate, in press)
21 Conclusions: • GFDL model late 21st century (ensemble) projections suggest a decrease in the number of hurricanes in the Atlantic (-24% to -32%), but nearly a doubling in the frequency of very intense (Cat 4-5) hurricanes by 2100. Preciptation rates in hurricanes are also projected to increase (~20% within 100km of storm center). • Based on present understanding, we would not expect a 10%/decade increase in Cat 4-5 frequency, if it occurred, to be detectable for a number of decades. • Not all individual climate models (when downscaled) produce an increase in Cat 4-5 frequency as was simulated for the 18-model ensemble climate change signal. • Remaining caveats include model limitations for the projected SST patterns (e.g., clouds; indirect aerosols); limitations of intense hurricane simulations; and observed data concerns (i.e., cat 4-5 record). • Future work: expanding TC downscaling work to other basins; statistical approaches to downscaling are also being pursued (Villarini/Smith et al.; Held and Zhao)