Download
1 / 15
150 likes | 255 Views
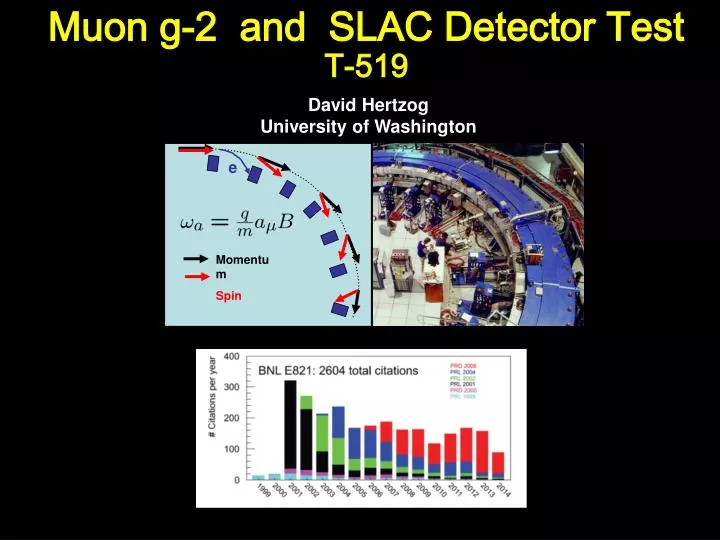
e. Momentum Spin. Muon g-2 and SLAC Detector Test T-519. David Hertzog University of Washington. w a Subset of g-2 Collaboration*. Udine. University of Washington. Trieste. Pisa. Cornell. University Illinois. Frascati. Roma II. University of Kentucky. University of Virginia

E N D
e Momentum Spin Muon g-2 and SLAC Detector Test T-519 David Hertzog University of Washington
wa Subset of g-2 Collaboration* Udine University of Washington Trieste Pisa Cornell University Illinois Frascati Roma II University of Kentucky University of Virginia James Madison Naples At SLAC Shanghai Jiao Tong *38 Institutes, 150 members
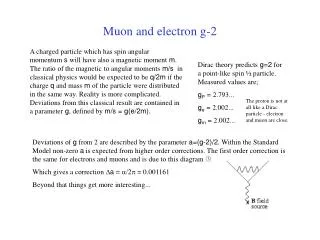
Goal: 140 ppb Future Goals Expected Improvement Three sigma is not enough to claim a discovery x10-11 BNL E821 Expect to turn on in late 2016 3.6 s a P5 priority 2012 e+e- Thy
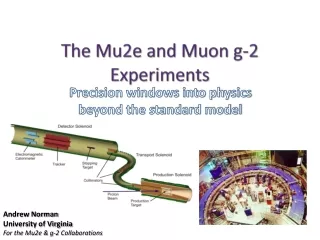
Why SLAC is importantWe measure muon decay to electrons 0 – 3.1 GeVDetectors must measure Energyand its Time and we must optimize them e+ Calorimeter Electronics Events above threshold Software threshold 5
Compact, non-magnetic calorimeters made of 54 Lead-Fluoride Cherenkov Crystals Read out by SiPMs (pixelated avalanche photodiodes run in Geiger mode)
Last November: SLAC T-512 Linearity Measured resolution with limited size array Learned how to use the beam effectively 3.5 GeV 2.5 – 4 GeV e- SiPMs (cooled), augmented by PMTs on sides Digitizers for pulse shapes
July 2014: T-519 Test 4x7 array of PbF2 crystals with SiPM readout using 2.2 – 4.5 GeV beam
Calibration System Set Absolute Gains • Laser Filter Wheel 10:90 Splitter • Source Monitor (pin diode) & PMT • Sphere or Diffuser • 4 monitors (pin diodes, PMT) • Fiber Bundle (60; 800 mm id) • Front plate + Focusing Lens • Crystals / SiPMs Tested in Seattle 2 weeks ago and also at SLAC Pulse shape pe from laser pulses 9
Typical beam on detector Usually Good small spot electrons per pulse 0 1 2 3 4 5 But, not always so …
Linearity Beam Energy Selection There remains an ambiguity between “requested” energy and delivered energy and an independent system that can calibrate the beam true energy (i.e., not the detector under “test”)
Now a selection of the good findings in what should be a publishable set of results dE/E = 2.2% 3.27 GeV 1500 pe/GeV Resolution 2.7% at 2 GeV Energy resolution exceeds our goal by a factor of 2
Position scanning using high-quality pencil-like beam and remote XY table Comment: Only possible with steady and high-quality beam conditions (takes many hours) Horizontal Scan (no gain correction)
Gain stability very important for g-2 Measured over 8 hours: (1.0 ± 1.4) x 10-4/ hour Data corrected by concurrent laser calibration system
Summary • Important for g-2 • Beam setup and quality critical • Great results to far • Hope to come again with complete calorimeter and all onboard electronics and DAQ. Possibly also Straw Tracker system • Thanks