Download
1 / 29
290 likes | 295 Views
Learn about the origins, purpose, and outcomes of shellfish restoration at TNC and the challenges and next steps for the future. Explore the importance of bivalves in regulating water quality and their potential for ecosystem services.

E N D
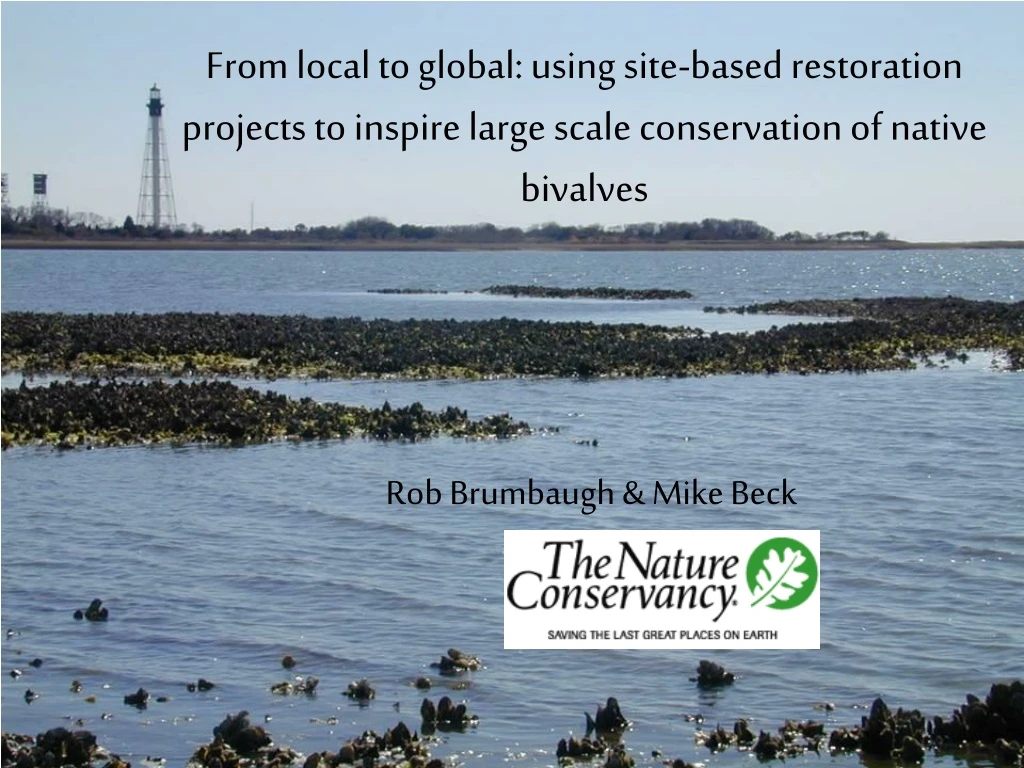
From local to global: using site-based restoration projects to inspire large scale conservation of native bivalves Rob Brumbaugh & Mike Beck
Acknowledgements • TNC staff leading shellfish restoration projects in 11 U.S. states: Anne Birch, Marci Bortman, Cindy Brown, Rafael Calderon, Chris Clapp, Jeff DeBlieu, Mark Dumesnil, Patrick Ertel, Jared Laing, Carl LoBue, Betsy Lyons, Wayne Grothe, Aaron McCall, Jay Odell, Adam Starke, Barry Truitt, Dick Vander Schaaf, Nicole Vickey, Jacques White; • National Partnership with NOAA’s Community-based Restoration Program; • Many partners in public management agencies, conservation organizations and academic research institutions who contribute to the Shellfish Restoration Network;
Outline • Shellfish Restoration at TNC: origins, purpose, initial outcomes • Current activities • Challenges • Next Steps and Hope for the Future
Condition of Common Estuarine Taxa in 12 Systems around the Globe Lotze et al 2006, SCIENCE
Minimal Nutrient Inputs Excessive Nutrient Inputs Sunlight Sunlight Algal Bloom Balanced Algae Growth Healthy Bay Grasses Reduced Bay Grasses Healthy System Eutrophic System Algae Die-off Algae Decomposition Adequate Oxygen No / Low Oxygen Adapted from Chesapeake Bay Program Regime Shift Abundant oysters Depleted oysters
Sanctuary reefs in NC: Class B rip-rap Limestone marl 150 – 300 tons per reef 2 m 2 – 3 m 5 – 1 0 m Graphic provided by NC Division of Marine Fisheries From Assessments to Action
Olympia oyster Eastern oyster Bay scallop Hard Clam Blue mussel TNC’s Shellfish Network Sites • Partnership based • Testing restoration strategies • Multiple sites are • leased or owned • Multi-species approach • Focus on Ecosystem Services
Practitioner’s Guide New handbook summarizes lessons learned and provides advice on: • The case for restoration • Identifying target species • Site selection • Monitoring approaches • Forming effective partnerships Brumbaugh, R.D., M.W. Beck, L.D. Coen, L. Craig and P. Hicks. 2006. The Nature Conservancy, Arlington VA. 28 pp.
Restoration Progress State-managed program for sanctuary-based restoration Spawner sanctuaries guard against recruitment failure 3-Dimensional reefs mimic historic reef habitat
Coral Reefs at Risk An impetus for research, conservation, improved management Low High Medium Bryant et al, 1998
Looking Globally… Shellfish Reefs at Risk Temperate Northern Hemisphere Low Risk-- Intact Shellfish Reefs & Beds • No synthesis of distribution, condition or threats (risk) • No compelling case for action
Assembling global dataset on distribution, abundance, condition & threats
Challenges Remain • Fisheries is primary driver for restoration • Environmental conditions • Most ecosystem services not valued ($)
Bivalve Shellfish - Ecosystem Services Valued • Provisioning – shellfish landings > Lots of information on landings, economic impact of fisheries, etc. (e.g., US $69M / year for eastern oyster) • Regulating – nursery habitat > Peterson et al (2003): estimated 2.6kg/m2/yr fish production from oyster reefs in SE estuaries – not expressed as $, but could be converted • Cultural – tourism, recreation > License revenue and numbers of participants • Supporting - filtration and nutrient cycling > Newell et al (2005): $314,836/yr for N removal by oysters in Choptank River; > Doug Lipton, University of MD (pers. comm.): $818M in N-removal as avoidance-cost for restored oyster population (i.e., in lieu of payment for other N-removal approaches);
How to measure progress? National Research Council, 2004
How much wood could a woodchuck chuckif a woodchuck could chuck wood?
How much water could an oyster reef filterif an oyster reef could filter water?
WATER QUALITY “REGULATION” BY SHELLFISH IS FUNCTION OF ABUNDANCE 10,000 No Water Quality Benefits 1,000 Clearance Time (days) 100 Clearance required for regulation 10 Shellfish Affect Water Quality 1 10 100 1 1,000 10,000 Residence Time (days) Adapted from: R. Dame, 1996. Ecology of Marine Bivalves: An Ecosystem Approach
10,000 No Water Quality Benefits 1,000 Clearance Time (days) 100 10 WQ Benefits 1 10 100 1 1,000 10,000 Residence Time (days) WATER QUALITY “REGULATION” BY SHELLFISH IS FUNCTION OF ABUNDANCE Residence Times SF Bay: 11 Ches Bay: 22-45 Narragansett: 27 Delaware Bay: 97 Chesapeake Bay - today Chesapeake Bay ~ 1870s Adapted from: R. Dame, 1996. Ecology of Marine Bivalves: An Ecosystem Approach
10,000 No Water Quality Benefits 1,000 Clearance Time (days) 100 10 WQ Benefits 1 10 100 1 1,000 10,000 Residence Time (days) WATER QUALITY “REGULATION” BY SHELLFISH IS FUNCTION OF ABUNDANCE Residence Times SF Bay: 11 Ches Bay: 22-45 Narragansett: 27 Delaware Bay: 97 Chesapeake Bay - today Chesapeake Bay ~ oysters restored Adapted from: R. Dame, 1996. Ecology of Marine Bivalves: An Ecosystem Approach
A microcosm of Chesapeake Bay • Depletion of oysters, wetlands & underwater grass • Excessive sedimentation • Nutrient enrichment • Urban and suburban storm water runoff (one difference: most of river closed to harvest) Case Study: Lynnhaven River, VA Lynnhaven River, Virginia Chesapeake Bay Watershed Area: 166,000 km2 Lynnhaven River Sub-Watershed Area: 166 km2
Restoration Progress River Volume = 2.4 x 10¹⁰ L (~ 9500 Olympic Swimming Pools) Restored Reef Area = 5.5 Acres = 20,257 m2 “Filtration Capacity” = 52 g DW / m2 = 6,259 L / day / m2 2005 Clearance Rate = 177 days Residence Time = 10 – 62 days
15 - 86 Acres of restored reefs required to ‘regulate’ water quality 10,000 No Water Quality Benefits 1,000 Clearance Time (days) 100 Clearance required for regulation 10 Shellfish Affect Water Quality 1 100 1 10 1,000 10,000 Residence Time (days) Adapted from: R. Dame, 1996. Ecology of Marine Bivalves: An Ecosystem Approach
Lynnhaven River, Virginia Relevance to Chesapeake Bay? Sub-Watershed Area: 166 km2 Watershed Area: 166,000 km2 FUNDING REQUIRED: $2.2 - 4.5 Billion RESTORATION INVESTMENT: $600K - $3.5 million
Are we even in the right ballpark??? National Research Council, 2004
Conclusions • A lot of projects and some progress - new and innovative partnerships have elevated restoration, enhanced monitoring; • Need to sharpen focus on ecosystem services to make ecological restoration more mainstream and large scale; • Shellfish Restoration Network to connect projects; • Global Reefs at Risk Assessment underway Seeking your involvement: Rob Brumbaugh rbrumbaugh@tnc.org
Our challenge “The nation behaves well if it treats the natural resources as assets which it must turn over to the next generation increased and not impaired in value.” - Theodore Roosevelt