Download
1 / 1
10 likes | 19 Views
2006. 2010. 2007. 2009. 2008. Nowcasting the emergent spread of White-nose Syndrome in Indiana bats. Wayne E. Thogmartin , USGSUpper Midwest Environmental Sciences Center , La Crosse, WI, wthogmartin@usgs.gov ;

E N D
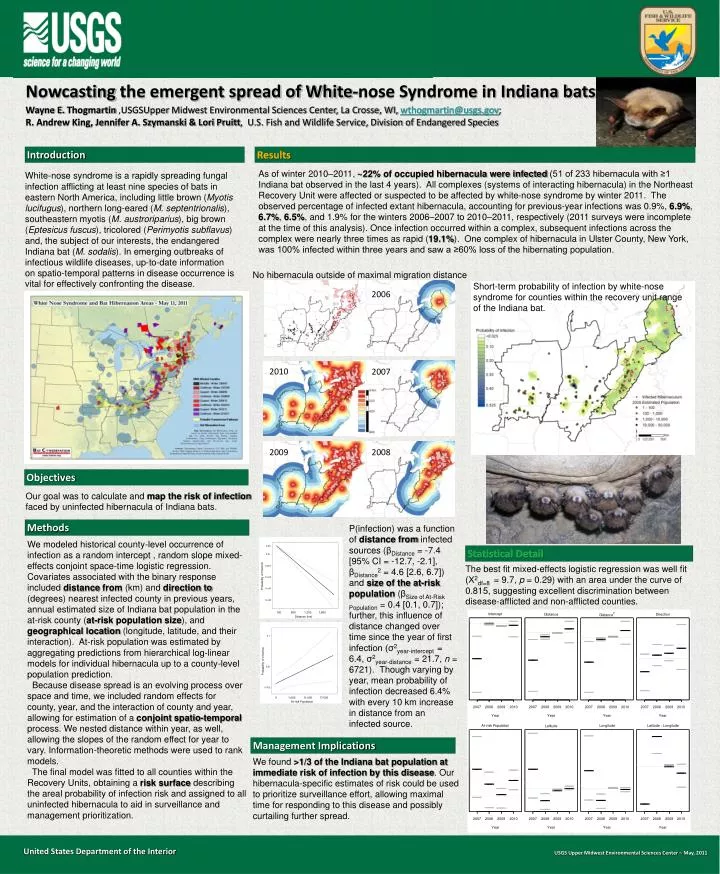
2006 2010 2007 2009 2008 Nowcasting the emergent spread of White-nose Syndrome in Indiana bats Wayne E. Thogmartin,USGSUpperMidwest Environmental Sciences Center, La Crosse, WI, wthogmartin@usgs.gov; R. Andrew King, Jennifer A. Szymanski & Lori Pruitt, U.S. Fish and Wildlife Service, Division of Endangered Species Results Introduction As of winter 2010–2011, ~22% of occupied hibernacula were infected (51 of 233 hibernacula with ≥1 Indiana bat observed in the last 4 years). All complexes (systems of interacting hibernacula) in the Northeast Recovery Unit were affected or suspected to be affected by white-nose syndrome by winter 2011. The observed percentage of infected extant hibernacula, accounting for previous-year infections was 0.9%, 6.9%, 6.7%, 6.5%, and 1.9% for the winters 2006–2007 to 2010–2011, respectively (2011 surveys were incomplete at the time of this analysis). Once infection occurred within a complex, subsequent infections across the complex were nearly three times as rapid (19.1%). One complex of hibernacula in Ulster County, New York, was 100% infected within three years and saw a ≥60% loss of the hibernating population. White-nose syndrome is a rapidly spreading fungal infection afflicting at least nine species of bats in eastern North America, including little brown (Myotislucifugus), northern long-eared (M. septentrionalis), southeastern myotis (M. austroriparius), big brown (Eptesicusfuscus), tricolored (Perimyotissubflavus) and, the subject of our interests, the endangered Indiana bat (M. sodalis). In emerging outbreaks of infectious wildlife diseases, up-to-date information on spatio-temporal patterns in disease occurrence is vital for effectively confronting the disease. No hibernacula outside of maximal migration distance Short-term probability of infection by white-nose syndrome for counties within the recovery unit range of the Indiana bat. Objectives Our goal was to calculate and map the risk of infection faced by uninfected hibernacula of Indiana bats. Methods P(infection) was a function of distance from infected sources (βDistance = -7.4 [95% CI = -12.7, -2.1], βDistance2 = 4.6 [2.6, 6.7]) and size of the at-risk population (βSize of At-Risk Population = 0.4 [0.1, 0.7]); further, this influence of distance changed over time since the year of first infection (σ2year-intercept = 6.4, σ2year-distance = 21.7, n = 6721). Though varying by year, mean probability of infection decreased 6.4% with every 10 km increase in distance from an infected source. We modeled historical county-level occurrence of infection as a random intercept , random slope mixed-effects conjoint space-time logistic regression. Covariates associated with the binary response included distancefrom (km) and direction to (degrees) nearest infected county in previous years, annual estimated size of Indiana bat population in the at-risk county (at-risk population size), and geographical location (longitude, latitude, and their interaction). At-risk population was estimated by aggregating predictions from hierarchical log-linear models for individual hibernacula up to a county-level population prediction. Because disease spread is an evolving process over space and time, we included random effects for county, year, and the interaction of county and year, allowing for estimation of a conjoint spatio-temporal process. We nested distance within year, as well, allowing the slopes of the random effect for year to vary. Information-theoretic methods were used to rank models. The final model was fitted to all counties within the Recovery Units, obtaining a risk surface describing the areal probability of infection risk and assigned to all uninfected hibernacula to aid in surveillance and management prioritization. Statistical Detail The best fit mixed-effects logistic regression was well fit (Χ2df=8 = 9.7, p = 0.29) with an area under the curve of 0.815, suggesting excellent discrimination between disease-afflicted and non-afflicted counties. Management Implications We found >1/3 of the Indiana bat population at immediate risk of infection by this disease. Our hibernacula-specific estimates of risk could be used to prioritize surveillance effort, allowing maximal time for responding to this disease and possibly curtailing further spread. United States Department of the Interior USGS Upper Midwest Environmental Sciences Center – May, 2011