Download
1 / 52
560 likes | 830 Views
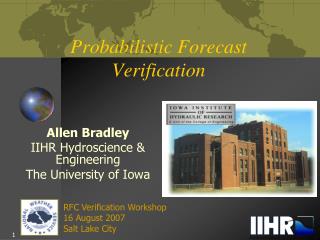
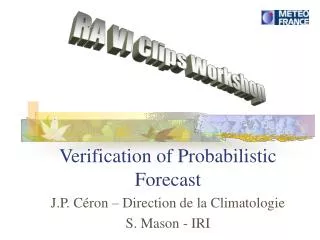
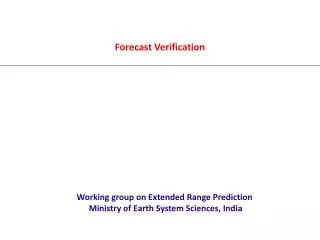
GFS Forecast Verification. Fanglin Yang NEMS/GFS Modeling Summer School 2013 July 29 th – August 1 st , 2013 Environmental Modeling Center National Centers for Environmental Prediction College Park, Maryland. Outline.

E N D
GFS Forecast Verification Fanglin Yang NEMS/GFS Modeling Summer School 2013 July 29th – August 1st, 2013 Environmental Modeling Center National Centers for Environmental Prediction College Park, Maryland
Outline • An Introduction to EMC Global NWP Model Deterministic Forecast Verification Package • Review of GFS Historical Performance • AC and RMSE • Hurricane Track and Intensity • Precipitation • Comparison with Surface and RawinsondeObs
NCEP-EMC Global NWP Model Verification Package • The main purpose of this package is to aid model developers in diagnosing forecast errors and in assessing model forecast skills. It is designed to be portable for different computer platforms, to be easy to set up for evaluating various experiments with minimum input from users, and to have a web interface for quick review of results. • Credit and Acknowledgment: All scripts and Fortran programs except for those listed below were written and maintained by Fanglin Yang. Binbin Zhou and Geoff DiMego provided the script and code for grid-to-grid database computation. Jack Woolen and SuranjanaSaha provided the script and code for making fit-to-obs maps. Perry Shafran and Geoff DiMego provided the Grid-to-Obs Fortran programs. All third-party codes and scripts have been modified before being included in this package. A few "NWPROD" libraries were adopted from the GFS para system ShrinivasMoorthi updated and built on Zeus for running on different platforms. A few changes made by Jim Jung to the grid-to-grid Fortran source code were taken to make the program compatible with Linux compilers. ShrinivasMoorthi helped with adding the script to port forecast data from different machines. Glenn White, Steve Lord and Xu Li made suggestions for creating and improving the significance test for AC dieoff curves and RMSE growth curves. Russ made a suggestion to include consensus analysis for verification. Helin Wei provided assistance for including the grid-to-obs verification. Many users have provided valuable comments and suggestions that helped improving the usability and portability of this package. • Where to obtain the package: (1) For NCEP CCS and WCOSS users: copy the driver /global/save/wx24fy/VRFY/vsdb/vsdbjob_submit.sh and parameter setting script setup_envs.sh. (2)For NOAA Zeus users: copy driver vsdbjob_submit.sh and parameter setting script setup_envs.sh from /scratch2/portfolios/NCEPDEV/global/save/Fanglin.Yang/VRFY/vsdb/. (3) For those who has access to NCEP/EMC SVN, find https://svnemc.ncep.noaa.gov/projects/verif/global/tags/vsdb_v16. (4) For users who have no access to NCEP computers and wish to install the entire package, please get vsdb_exp_v16.tar by ftp from http://ftp.emc.ncep.noaa.gov/gc_wmb/wx24fy/VRFY/.
NCEP-EMC Global NWP Model Verification Package It performs the following verifications for NWP forecasts: • AC, RMSE, BIAS etc: model forecast statistics are first computed and saved in VSDB format; verification maps are then made to compare stats among different experiments and/or with operational forecast (up to 10 experiments) • QPF: precipitation threat skill scores over CONUS are first computed , then ETS score maps are made with Monte Carlo significance tests included. • 2D MAPS: make maps of lat-lon distributions and zonal mean vertical cross-sections of forecast s, analyses and certain observations, such as U,V,T,Q,RH,O3, T2m, Precip, etc. • Fit-to-Obs: compare forecasts and analyses against rawinsonde observations • Grid-to-Obs: verifying forecasts against surface station observations (e.g. T2m and 10-m wind) and upper-air RAOBS • transfer maps and web templates to web servers for display. Example: http://www.emc.ncep.noaa.gov/gmb/wx24fy/para/t2mbias/exp2012/ and http://www.emc.ncep.noaa.gov/gmb/STATS_vsdb/
Outline • Major GFS Changes in the Past 30 Years • Review of GFS Historical Performance • AC and RMSE • Hurricane Track and Intensity • Precipitation • Comparison with Surface and RawinsondeObs
Annual Mean 500-hPa HGT Day-5 Anomaly Correlation 0.1/10yrs CDAS is a legacy GFS (T64) used for NCEP/NCAR Reanalysis circa 1995 CFSR is the coupled GFS (T126) used for reanalysis circa 2006
Annual Mean 500-hPa HGT Day-5 Anomaly CorrelationGFS minus CDAS Best Year, For both NH and SH
Annual Mean NH 500hPa HGT Day-5 AC • ECMWF, GFS and CMC were better in 2012 than in 2011. GFS has the largest gain. • UKM and FNOMC were slightly worse in 2012 than 2011.
Annual Mean SH 500hPa HGT Day-5 AC • 2012 was a difficult year to forecast, namely, both CFSR and CDAS scores dropped. • Most models, except for GFS and CMC, had lower scores in 2012 than in 2011.
Die-off Curves of Annual Mean NH 500hPa HGT AC 0.6 – useful forecast For 2012 GFS: 8.0 day ECMWF: 8.2 day CDAS: 6.4 day ECMWF ‘s useful forecast in 2012 was not as good as in 2010 and 2011. GFS had no change in past three years.
Die-off Curves of Annual Mean SH 500hPa HGT AC 0.6 – useful forecast For 2012 GFS: 7.6 day ECMWF: 8.2 day CDAS: 6.5 day
GFS GFS useful forecasts (AC>0.6) increased about one day in the past decade. All Models
Twenty bins were used to count for the frequency distribution, with the 1st bin centered at 0.025 and the last been centered at 0.975. The width of each bin is 0.05. AC Frequency Distribution More GOOD forecasts GFS NH • Jan 2000: T126L28 T170L42 • May 2001: prognostic cloud • Oct 2002: T170L42 T254L64 • May 2005: T254L64 T382L64; • 2-L OSU LSM 4-L NOHA LSM • May 2007: SSI GSI Analysis; • Sigma sigma-p hybrid coordinate • July 2010: T382L64 T574L64; Major Physics Upgrade • May 2012: Hybrid-Ensemble 3D-VAR Data Assimilation
AC Frequency Distribution GFS SH • Jan 2000: T126L28 T170L42 • May 2001: prognostic cloud • Oct 2002: T170L42 T254L64 • May 2005: T254L64 T382L64; • 2-L OSU LSM 4-L NOHA LSM • May 2007: SSI GSI Analysis; • Sigma sigma-p hybrid coordinate • July 2010: T382L64 T574L64; Major Physics Upgrade • May 2012: Hybrid-Ensemble 3D-VAR Data Assimilation
AC Frequency Distribution ECMWF NH
AC Frequency Distribution ECMWF SH
Jan 2000: T126L28 T170L42 • May 2001: prognostic cloud • Oct 2002: T170L42 T254L64 • May 2005: T254L64 T382L64; • 2-L OSU LSM 4-L NOHA LSM • May 2007: SSI GSI Analysis; • Sigma sigma-p hybrid coordinate • July 2010: T382L64 T574L64; Major Physics Upgrade • May 2012: Hybrid-Ensemble 3D-VAR Data Assimilation
2012 is the first year for which GFS has no “BAD” forecast in the Northern Hemisphere • Jan 2000: T126L28 T170L42 • May 2001: prognostic cloud • Oct 2002: T170L42 T254L64 • May 2005: T254L64 T382L64; • 2-L OSU LSM 4-L NOHA LSM • May 2007: SSI GSI Analysis; • Sigma sigma-p hybrid coordinate • July 2010: T382L64 T574L64; Major Physics Upgrade • May 2012: Hybrid-Ensemble 3D-VAR Data Assimilation
Tropical Wind RMSE, 850-hPa Day-3 Forecast July2010 T574 GFS Implementation
Tropical Wind RMSE, 200-hPa Day-3 Forecast GFS matched UKM after Hybrid EnKF Implementation
Outline • Major GFS Changes in the Past 30 Years • Review of GFS Historical Performance • AC and RMSE • Hurricane Track and Intensity • Precipitation • Comparison with Surface and RawinsondeObs
2012 Atlantic Hurricanes www.nhc.noaa.gov/ http://www.wikipedia.org
2012 Eastern Pacific Hurricanes www.nhc.noaa.gov/ http://www.wikipedia.org
Sandy Track ForecastsGlobal Deterministic NWP Models www.wikipedia.org www.livescience.com
GFS and ECMWF Rainfall Forecasts for Sandy, 5 days before landfall
GFS and ECMWF Rainfall Forecasts for Sandy, 3 days before landfall
Hurricane Track and Intensity Forecast ErrorsNCEP GFS : 2001 ~ 2012
Outline • Major GFS Changes in the Past 30 Years • Review of GFS Historical Performance • AC and RMSE • Hurricane Track and Intensity • Precipitation • Comparison with Surface and RawinsondeObs
2012 Annual Mean CONUS Precipitation Skill Scores, 0-72 hour Forecast BIAS=1 is perfect Larger ETS is better • ECMWF has the best ETS, but it tends to underestimate heavy rainfall events. • GFS’s ETS score is only better than NAM; however, GFS has better BIAS score than most of the other models..
GFS CONUS Precipitation Skill Scores, Annual Mean, 2003 ~ 2012 In the past three years (2010~2012), GFS annual mean ETS was improved; BIAS was reduced, especially for medium rainfall events.
GFS CONUS Precipitation Skill Scores, Summer ( JJA) Mean, 2003 ~ 2012 • In the past two years (2011~2012), GFS summer QPF scores were degraded for light rainfall events (lower ETS and larger BIAS). • This degradation was caused by excessive evaportranspiration in warm season. A soil table (Minimum Canopy Resistance and Root Depth Number) was changed in May-2011 Implementation. • This table has been reversed back to its older version since 09/05/2012. See slide 9 for the improvement of light rainfall QPF scores.
Outline • Major GFS Changes in the Past 30 Years • Review of GFS Historical Performance • AC and RMSE • Hurricane Track and Intensity • Precipitation • Comparison with Surface and RawinsondeObs
US Northern Plains, T2m Verified against Surface Station Observations Early Morning Late afternoon • For 2012, ECMWF had almost perfect forecast of surface temperature in the afternoon, but was slightly too warm in the morning. • GFS had good T2m forecast in the morning, but was too cold in the afternoon in the warm season.
US T2m Verified against Surface Station Observations Northwest Northeast GFS and ECMWF were similar in the west GFS is too cold in the east Southwest Southeast
Temperature Bias , Verified against Rawinsonde Observations, 2012 Annual Mean NH SH Compared to RAOBS GFS was too warm in the upper troposphere and too cold at the tropopause and lower stratosphere. ECMF was too cold in the stratosphere. ECMWF was better than the GFS in the troposphere but worse in the stratosphere. Tropics
Temperature Bias Verified against RAOBS, Northern Hemisphere, 120hr Fcst 50 hPa 150 hPa It seems GFS cold bias near the tropopause was reduced after the May-2012 Hybrid EnKF implementation. No seasonal variation in the upper troposphere. ECMWF cold bias in the stratosphere was the worst in the first few months. 300 hPa
Major GFS Changes • 1980’s • 08/1980: R30L12 , first NMC operational NWP model • 10/1983: R40L12 • 04/1985: R40L18 - GFDL physics • 06/1986: R40L18 - convection extended to the tropopause • 08/1987: T80L18 –triangular truncation, with diurnal cycle, moisture at all layers • 01/1988: T80L18 - interactive clouds • 03/1991: • T80L18 to T126L18, mean orog, new SST, marine stratus, reduced horizontal diffusion • 06/1991 • SSI (Spectral Statistical Interpolation)analysis • 08/1993 • Arakawa-Schubert deep convection, 28 layers • 10/1995 • Satellite radiances instead of T retrievals; ERS-1 winds • 01/1998 • - TOVS-1b radiances; vertical diffusion in free atmosphere; 3-D Ozone
Major GFS Changes • 3/1999 • AMSU-Aand HIRS-3 high resolution data from NOAA-15 satellite • 2/2000 • Resolution change: T126L28 T170L42 (100 km 70 km) • Next changes • 7/2000 (hurricane relocation) • 8/2000 (data cutoff for 06 and 18 UTC) • 10/2000 – package of minor changes • 2/2001 – radiance and moisture analysis changes • 5/2001 • Major physics upgrade (prognostic cloud water, cumulus momentum transport) • Improved QC for AMSU radiances • Next changes • 6/2001 – vegetation fraction • 7/2001 – SST satellite data • 8/200 – sea ice mask, gravity wave drag adjustment, random cloud tops, land surface evaporation, cloud microphysics…) • 10/ 2001 – snow depth from model background • 1/2002 – Quikscat included
Major GFS Changes (cont’d) • 11/2002 • Resolution change: T170L42 T254L64 (70 km 55 km) • Recomputed background error • Divergence tendency constraint in tropics turned off • Next changes • 3/2003 – NOAA-17 radiances, NOAA-16 AMSU restored, Quikscat 0.5 degree data • 8/2003 – RRTM longwave and trace gases • 10/2003 – NOAA-17 AMSU-A turned off • 11/2003 – Minor analysis changes • 2/2004 – mountain blocking added • 5/2004 – NOAA-16 HIRS turned off • 5/2005 • Resolution change: T254L64 T382L64 ( 55 km 38 km ) • 2-L OSU LSM 4-L NOHA LSM • Reduce background vertical diffusion • Retune mountain blocking • Next changes • 6/2005 – Increase vegetation canopy resistance • 7/2005 – Correct temperature error near top of model
Major GFS Changes (cont’d) • 8/2006 • Revised orography and land-sea mask • NRL ozone physics • Upgrade snow analysis • 5/2007 • SSI (Spectral Statistical Interpolation) GSI ( Gridpoint Statistical Interpolation). • Vertical coordinate changed from sigma to hybrid sigma-pressure • New observations (COSMIC, full resolution AIRS, METOP HIRS, AMSU-A and MHS) • 12/2007 • JMA high resolution winds and SBUV-8 ozone observations added • 2/2009 • Flow-dependent weighting of background error variances • Variational Quality Control • METOP IASI observations added • Updated Community Radiative Transfer Model coefficients • 7/2010 • Resolution Change:T382L64 T574L64 ( 38 km 23 km ) • Major radiation package upgrade (RRTM2 , aerosol, surface albedo etc) • New mass flux shallow convection scheme; revised deep convection and PBL scheme • Positive-definite tracer transport scheme to remove negative water vapor