Download
1 / 14
140 likes | 257 Views
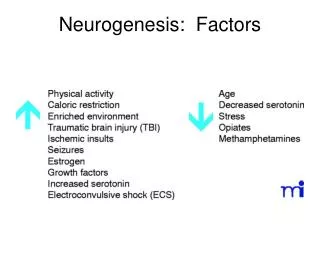
REGULATION OF HISTONE ACETYLATION IN THE HIPPOCAMPUS OF CHRONICALLY STRESSED RATS: A POTENTIAL ROLE OF SIRTUINS. In Hippocampus Chronic Variable Stress (CVS) Induces :. Suppression of Synaptic Plasticity (CA1). Decreased Neurogenesis (Dentate Gyrus). Atropy in Apical Dendrites (CA3).

E N D
REGULATION OF HISTONE ACETYLATION IN THE HIPPOCAMPUS OFCHRONICALLY STRESSED RATS: A POTENTIAL ROLE OF SIRTUINS
In Hippocampus Chronic Variable Stress (CVS) Induces: Suppression of Synaptic Plasticity (CA1) Decreased Neurogenesis (Dentate Gyrus) Atropy in Apical Dendrites (CA3)
Design Housed in Pairs Day 56 Chronic Variable Stress(CVS) Control Morning Stressor Overnight Stressor Afternoon Stressor Two Weeks
Fig. 2. Physiological measures of chronic stress. Quantification of physical parameters from animals subjected to either control conditions or 14 d of chronic variable stress (CVS). (A) CVS results in a significant decrease in weight gain (n=12) compared to control (n=12). (B) Serum levels of corticosterone from trunk blood are increased in CVS animals compared to control animals (n=9). (C) A significant increase in adrenal weight relative to body weight was seen in CVS animals compared to control animals (measured as mg/100 g body weight; n=12). (D) A reduction in sucrose preference was observed following CVS (measured as % sucrose intake/total fluid intake; n=6). Data are shown as means±SE; * P<0.05 vs. control; ** P<0.01 vs. control; *** P<0.0001 vs. control. Fig. 2. Physiological measures of chronic stress. Quantification of physical parameters from animals subjected to either control conditions or 14 d of chronic variable stress (CVS). (A) CVS results in a significant decrease in weight gain (n=12) compared to control (n=12). (B) Serum levels of corticosterone from trunk blood are increased in CVS animals compared to control animals (n=9). (C) A significant increase in adrenal weight relative to body weight was seen in CVS animals compared to control animals (measured as mg/100 g body weight; n=12). (D) A reduction in sucrose preference was observed following CVS (measured as % sucrose intake/total fluid intake; n=6). Data are shown as means±SE; * P<0.05 vs. control; ** P<0.01 vs. control; *** P<0.0001 vs. control. Fig. 2. Physiological measures of chronic stress. Quantification of physical parameters from animals subjected to either control conditions or 14 d of chronic variable stress (CVS). (A) CVS results in a significant decrease in weight gain (n=12) compared to control (n=12). (B) Serum levels of corticosterone from trunk blood are increased in CVS animals compared to control animals (n=9). (C) A significant increase in adrenal weight relative to body weight was seen in CVS animals compared to control animals (measured as mg/100 g body weight; n=12). (D) A reduction in sucrose preference was observed following CVS (measured as % sucrose intake/total fluid intake; n=6). Data are shown as means±SE; * P<0.05 vs. control; ** P<0.01 vs. control; *** P<0.0001 vs. control. Fig. 2. Physiological measures of chronic stress. Quantification of physical parameters from animals subjected to either control conditions or 14 d of chronic variable stress (CVS). (A) CVS results in a significant decrease in weight gain (n=12) compared to control (n=12). (B) Serum levels of corticosterone from trunk blood are increased in CVS animals compared to control animals (n=9). (C) A significant increase in adrenal weight relative to body weight was seen in CVS animals compared to control animals (measured as mg/100 g body weight; n=12). (D) A reduction in sucrose preference was observed following CVS (measured as % sucrose intake/total fluid intake; n=6). Data are shown as means±SE; * P<0.05 vs. control; ** P<0.01 vs. control; *** P<0.0001 vs. control. Fig. 2. Physiological measures of chronic stress. Quantification of physical parameters from animals subjected to either control conditions or 14 d of chronic variable stress (CVS). (A) CVS results in a significant decrease in weight gain (n=12) compared to control (n=12). (B) Serum levels of corticosterone from trunk blood are increased in CVS animals compared to control animals (n=9). (C) A significant increase in adrenal weight relative to body weight was seen in CVS animals compared to control animals (measured as mg/100 g body weight; n=12). (D) A reduction in sucrose preference was observed following CVS (measured as % sucrose intake/total fluid intake; n=6). Data are shown as means±SE; * P<0.05 vs. control; ** P<0.01 vs. control; *** P<0.0001 vs. control.
Histone Deacetylases (HDACS) Class I VIII II I III Class II VIII VII IX VI V IV X Class III Sirtuins 5 6 7 1 2 3 4 Class IV XI
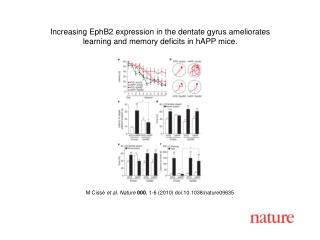
Fig. 3. Histone acetylation changes in the hippocampus are subregion-specific. Quantification and representative Western blots of histone acetylation extracted from subdissected hippocampus of control and chronic variable stress (CVS) animals. (A) Immunoblotting of acetylatedhistone 4 lysine 12 [aH4(K12)] antibody showed a trend toward a decrease in the CA1 region of the hippocampus in CVS animals compared to control animals. (B) A significant decrease in acetylation of H4(K12) was observed in CA3. (C) In the dentate gyrus (DG) region of thehippocampus, CVS resulted in a significant decrease in band density of aH4(K12) acetylated antibody compared to control animals. (D, E, F) Representative Western blots of aH4(K12) and total H3 for CA3 (D), CA1 (E) and DG (F) regions of the hippocampus. (G) Western blotting of phospho-acetylation of histone 3 at lysine9/serine 10 [paH3(K9/S10)] demonstrated that levels remained unchanged in CA1. (H) A significant decrease in paH3(K9/S10) band density was observed in CA3 of CVS animals compared to control animals. (I) A significant difference in paH3(K9/S10) was observed in the DG between control and CVS animals. (J, K, L) Representative Western blots of paH3 (K9/S10) and total H3. Data are shown as means±SE; * P<0.05 vs. control (n=5–6 animals per group).
Fig. 4. Deacetylation of histones by Class I/II histone deacetylases (HDACs) in control and CVS-treated hippocampus. Western blot analysis of changes in histone 3 and histone 4 acetylation in response to HDAC inhibition in whole hippocampus slices from control and chronic variable stress (CVS) animals treated for 1-h with either vehicle or 300 μm sodium butyrate (NaB). (A) Quantification of percentage change from vehicle treated slices in acetylation of lysine 12 on histone 4 [aH4(K12)]. A significant increase from vehicle in K12H4 acetylation was observed in CVS animals compared to control animals. (B) Phospho-acetylation of lysine 9/serine 10 on histone 3 [paH3(K9/S10)] quantification of percentage change mediated by NaB compared to vehicle treated slices. No significant change from vehicle was observed in CVS animals compared to control animals. (C) Quantification and representative Western blots from nuclear protein extracted from subdissected hippocampus tissue from control and CVS animals. A significant increase in histone deacetylase 5 (HDAC5) protein expression was observed in the CA1 region of CVS animals compared to control animals with no change in either CA3 or DG. Representative Western blot of GAPDH protein expression are shown as a loading control. Data are shown as means±SE; * P<0.05 vs. control (n=4 animals per group).
Fig. 5. Inhibition of sirtuins increases histone acetylation only in chronic variable stress (CVS) treated hippocampus. Western blot analysis ofhistone acetylation extracted from whole hippocampus slices from control and chronic variable stress (CVS) animals treated for 1-h with either vehicle or 100 μm sirtinol. (A) Quantification of percentage change from vehicle treated slices in acetylation of K12H4. Pharmacological application of sirtinol resulted in a significant increase from vehicle in CVS animals compared to control animals. (B) Phospho-acetylation of K9/S10 H3 quantification of percentage change from vehicle treated slices. A significant increase from vehicle in phospho-acetylation of H3 was observed in CVS animals compared to control animals. Data are shown as means±SE; * P<0.05 vs. control; ** P<0.01 vs. control (n=4 animals per group).
Fig. 6. Regulation of sirtuin 1 activity and protein expression in chronic stress. (A) Quantification and representative Western blots of sirtuin 1expression from nuclear protein extracted from subdissected hippocampus of control and chronic variable stress (CVS) animals. No significant difference from control animals in sirtuin 1 protein expression was seen in CA1, CA3, and DG regions in CVS animals (n=4). Representative blots from GAPDH are shown as protein loading control. (B) Quantification of Sirt 1 activity in nuclear extract from subdissected hippocampus of control and CVS animals. A significant increase in enzymatic activity of Sirt 1 was found in the CA3 and DGregions of the hippocampus of CVS animals compared to control animals. No change from control was seen in CA1 [data is represented as arbitrary florescence units (AFU) relative to control; n=4]. (C) Quantification and representative western blots of p53 acetylation relative to total p53 expression from nuclear protein extracted from subdissected hippocampus of control and CVS animals. A significant decrease in acetylation of p53 was observed in the CA3 and DG hippocampus regions of CVS animals compared to control animals while no difference from control was observed in CA1 (n=6). Data are shown as means±SE; * P<0.05 vs. control; *** P<0.0001 vs. control.