Download
1 / 55
550 likes | 664 Views
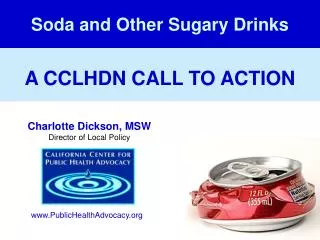
Soda and Other Sugary Drinks. A CCLHDN CALL TO ACTION. Charlotte Dickson, MSW Director of Local Policy. www.PublicHealthAdvocacy.org. Promote the establishment of public health policy at both the state and local levels. Childhood Obesity School Nutrition Standards

E N D
Soda and Other Sugary Drinks A CCLHDN CALL TO ACTION Charlotte Dickson, MSW Director of Local Policy www.PublicHealthAdvocacy.org
Promote the establishment of public health policy at both the state and local levels • Childhood Obesity • School Nutrition Standards • Physical Education Funding • Menu labeling in Chain Restaurants • Soda & other sugary drinks Because health doesn’t just happen
California’s Economic Costsof Overweight, Obesity and Physical Inactivity
Individual Behavior OR The Environment
Individual Behavior WITHIN The Environment The social, economic, and political context in which we make our food and activity choices Public Policy Public Policy
MajorPublic Health Movements • Sanitation • Worker Safety • Clear Air / Clean Water • Auto Safety • Drunk Driving • Lead Poisoning • Violence Prevention • Tobacco Control
UNIVERSALLESSONS • Solution is NOT only a matter of personal responsibility • Education is critical, AND • School and community environments must be changed • Federal, state, and local policies are crucial 24.3%
7Reasons to Focus on Sugar-LoadedBeverages 1.Primary Source of Sugar in U.S. diet 10 tsp 17 tsp 27 tsp 8 33 oz 20 oz 12 oz teaspoons of sugar
7Reasons to Focus on Sugar-Loaded Beverages 1.Primary Source of Sugar in U.S. diet 2.Consumed in massive quantities 8
ADULTConsumptionof Sugar-Loaded Beverages in California 50 gallons per year 39 pounds of sugar
KIDSConsumption of Sugar-Loaded Beverages in California DRINK A SODA OR MORE A DAY Age 2-11: 41% Age 12-17: 62% 175 calories per day!
YOUNG KIDS (2-5) Consumption of Sugar-Sweetened Beverages in California 33% Drink soda daily Alameda 24% Orange 24% Sacramento 27% Riverside 36% Los Angeles 39% Merced 45% San Bernardino 45% Fresno 57% Imperial 59% Whites: 25% Latinos: 42% African Americans: 47%
7Reasons to Focus on Sugar-Loaded Beverages 1.Primary Source of Sugar in U.S. diet 2.Consumed in massive quantities Clearly linked to obesity and diabetes 8
7Reasons to Focus on Sugar-Loaded Beverages 1.Primary Source of Sugar in U.S. diet 2.Consumed in massive quantities 3.Clearly linked to obesity and diabetes 4.No nutritional benefits 5.Poor calorie compensation 8
Change in Appetite Influenced by Form ofSugar Liquid Sugar 9% compensation Solid Sugar 64% compensation (Source: Mattes, 1996)
7Reasons to Focus on Sugar-Loaded Beverages 1.Primary Source of Sugar in U.S. diet 2.Consumed in massive quantities 3.Clearly linked to obesity and diabetes 4.No nutritional benefits 5.Poor calorie compensation Primary cause of dental decay 8
Soda consumption doubles the risk of cavitated dental caries
7Reasons to Focus on Sugar-Loaded Beverages 1.Primary Source of Sugar in U.S. diet 2.Consumed in massive quantities 3.Clearly linked to obesity and diabetes 4.No nutritional benefits 5.Poor calorie compensation Primary cause of dental decay Food product MOST marketed to children! ($500 million annually) Beverage environment has changed dramatically 8
Portion Size 6.5 oz (1920s) 12 oz (1960s) 20 oz (1990s) 33 oz (1L) Today
Portion Size How did it happen? 6.5 oz (1920s) 12 oz (1960s) 20 oz (1990s) 33 oz (1L) Today
Portion Size How did it happen? 6.5 oz (1920s) 12 oz (1960s) 20 oz (1990s) 33 oz (1L) Today
Portion Size How did it happen? 6.5 oz (1920s) 12 oz (1960s) 20 oz (1990s) 33 oz (1L) Today
SODA… Best Deal on the Market! Consumer Price Index, 2010
Increase in Per Capita Calorie Intake (1977 – 2001) Equivalent of 43% of new calories 278 cal/day 120 cal/day Huge Contributor to Obesity Epidemic
Sweetened beverage intake nearly tripled University of California, Berkeley
CA Campaign for Healthy Beverages • Public education • Grassroots organizing • City & county policies • State policies
One penny per ounce • Raise $1.7 billion annual • Funds for obesity prevention AB 699 (Monning) Sugar-Sweetened Beverage Tax GOAL: Fund communities in proportion to consumption
Public Support for Soda Tax 56% of voters support • Low Income (<$40k/year): 60% • Latinos: 66% Field Research, April 2010 Sample of 503 registered voters
Local BeveragePolicies • Vending machines on city / county property, youth venues, parks & recs, businesses • Purchasing policy • Marketing / sponsorship • Access to clean water for everyone Everyone has a role to play
Proposition 99 1988: $90 million/year for social norm change 1999: Results were clear • 27% decrease in smoking • 19% decrease in lung cancer deaths • 10% lower than rest of country “Seeing dramatic results like these is proof that what we have done in California has worked.” Diana Bonta, State Health Director (2003)
Surgeon General on Smoking: 1964 “…cigarette smoking contributes substantially to mortality from certain specific diseases and to the overall death rate.”
Per Capita Cigarette Consumption1955-2002 5,000 4,000 1964 3,000 2,000 Number of cigarettes 1,000 1955 1970 1980 1990 2002 US adults (18+ years)
Tobacco Policies • Smoke-free schools, workplaces • Extensive K-12 education • Health care sector participation • Advertising restrictions • Warning labels • Tobacco taxes (CA Prop 99) - funding state/local programs - anti-tobacco ads
Surgeon General on Diet: 1988 “…over consumption of certain dietary compo-nents is now a major concern for Americans.”
Surgeon General on Obesity: 2001 “Overweight and obesity have reached epidemic proportions nationwide.”
Overweight Prevalence* 1980-2010 80% 60% 40% Percent Overweight 20% 1988 * US adults (18+ years)