Download
1 / 27
280 likes | 426 Views
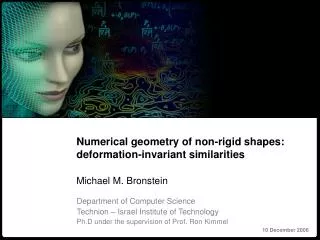
Perception of Non-rigid 3D Shapes from Motion Cues. Qasim Zaidi & Anshul Jain Graduate Center for Vision Research SUNY College of Optometry. Many objects deform as they move. Clips taken from bioMovies @ NCSU.

E N D
Perception of Non-rigid 3D Shapes from Motion Cues QasimZaidi & Anshul Jain Graduate Center for Vision Research SUNY College of Optometry
Many objects deform as they move Clips taken from bioMovies @ NCSU Surprisingly, there are no psychophysical studies that deal with disentangling general shape changes from object motion
Extracting Rigid 3-D Shape-from-Motion • Incremental Rigidity: • e.g. Ullman (1984), Grzywacz & Hildreth (1985) • Motion Perspective: • e.g. Helmhotz (1925), Gibson et al. (1955), Sperling et al. (1989) • Local Def based • e.g. Longuet-Higgins & Prazdny, 1980; Koenderink, 1986; Domini et al. 2003
Extracting Non-rigid 3-D Shape-from-Motion • Biological Motion • Johansson, 1973 and many others • Neural model based on snapshot neurons (Giese & Poggio, 2003) • But what about more general shapes?
Factorization Method (Tomasi & Kanade, 1992) • F views of P points (u,v) of a 3-D rigid shape S give the image matrix W, which has to be factorized into a Rotation R and a Shape matrix S. • Since S is 3-D, Rank(W) = 3, so the three largest eigen-values from an SVD give the non-unique factorization: • To obtain the unique R from R’, using the orthonormal property of a rotation matrix, we find Q such that, • Then the 3-D shape is estimated by:
Extension to Non-rigid Shapes (x,y,z) Points of 3-D Shape • Since, the shape changes on every frame the shape matrix now is: Frames
Extension to Non-rigid Shapes • Shape basis (Bregler et al., 2000): • Trajectory basis (Akhter et al., 2008): • Since, the shape changes on every frame the shape matrix now is: Shape Space Trajectory Space
Experiment 1 – Categorical judgments for non-rigid shapes • Question:Do observers judge deviations from circularity of a cylinder for non-rigid shapes as well as they do for rigid shapes? • Stimuli • Point-light cylinders of varying cross-section with occluded central segments • Rotation (duration 1s): 120 deg/sec about z-axis; 180 deg/sec about y-axis • Task: 2AFC task – Deeper OR Shallower than perfect cylinder Rigid Cylinder Depth-flex Cylinder Plane-flex Cylinder
Results – Experiment 1 (8 observers) • The psychometric curves have similar slopes, implying similar sensitivity. • The mean point of subjective circularity is within 20% of veridical • 5/8 observers perceived NRP cylinders as deepest • 5/8 observers perceived FR cylinders as shallowest Depth/Width Ratio
Trajectory based Model • Since, the objects usually deform smoothly, the trajectories of points in 3-D space can be modeled as a linear combination of basis trajectories e.g. oscillations of different frequencies. • For the trajectory of each point, we can thus estimate the linear coefficients of cosine trajectories, which together define the 3-D non-rigid shape (Akhter et al., 2008): … + AK * + A1 * = A0 *
Motion Perspective Model • Observers assume that near points move faster than far points (Helmhotz, Gibson). • For each frame we computed the instantaneous local velocity at an image point (i,j) • Then, for a small slice across the cross-section we computed the Velocity Contrast Metric (VCM) • The VCM for each stimulus was computed by averaging across all slices for all frames.
Modeling Results - Experiment 1 • The trend in the observed data were explained better by the simple Motion Perspective model than by the Trajectory based model. • Stimuli with higher Velocity Contrast Metric were generally perceived as deeper (NRP) and stimuli with lower VCM were generally perceived as shallower (FR)
Experiment 2 – Asymmetric Percepts from Symmetric Cylinders Simple Motion Complex Motion • Stimuli • The stimuli were constructed in the same manner as in Experiment 1. • Rotation: Simple (only about Y-axis) or Complex (about Y- and Z-axes) • Task • 2AFC task: symmetric or asymmetric cylinder
Velocity Profile – Plane-flex cylinder Increasing Velocity Simple Motion • Under simple motion the profile is symmetric around the horizontal mid-section of the cylinder. Complex Motion • Under complex motion, the peak is shifted to the top; the profile is asymmetric along the width of the cylinder. Aspect Ratio = 0.71 Aspect Ratio = 0.71 Aspect Ratio = 1 Aspect Ratio = 1 Aspect Ratio = 1.41 Aspect Ratio = 1.41
Asymmetry Metric (AM) Shape Profile as Simulated Shape Profile as Computed from Model Cylinder Depth Cylinder Width Asymmetry Metric = Mean-squared error
Modeling Results - Experiment 2 • Asymmetry in the velocity profile is reflected in the percept • Neither of the two models can entirely explain the percept
Experiment 3 – Detection of Inflation/Deflation in presence of Non-rigidities Rigid Inflation Plane-flex Deflation Depth-flex Inflation • Stimuli • The stimuli were constructed in the same manner as in Experiment 1. • The stimuli inflated/deflated smoothly for the first half and then deflated/inflated for the second half of the presentation • Task • 2AFC judgment: inflation followed by deflation or the opposite sequence
Results – Experiment 3 (9 untrained observers) 90% Inflation 50% Inflation 90% Deflation 25% Inflation 50% Deflation 25% Deflation Time
82% Accuracy Thresholds – Experiment 3 (4 trained observers)
Changes in VCM due to Inflation/Deflation Simulated % Shape Change Computed % Shape Change The velocity based metric extracts the simulated change fairly well.
Changes in Trajectory based Shape due to Inflation/Deflation Simulated % Shape Change Computed % Shape Change The trajectory based metric does not fit as well as the velocity based metric
Conclusions • Human observers can judge shapes of non-rigid objects as well as they do for rigid objects. • The human perceptual system does not require a rigidity assumption to extract 3-D shape from motion cues. • The perceptual system presumably relies on velocity measurements to compute the structure • Detecting inflation or deflation in depth of rigid and non-rigid bodies is extremely difficult without extensive experience. • Supported by: NEI grants EY07556 & EY13312 to QZ