Download
1 / 35
420 likes | 807 Views
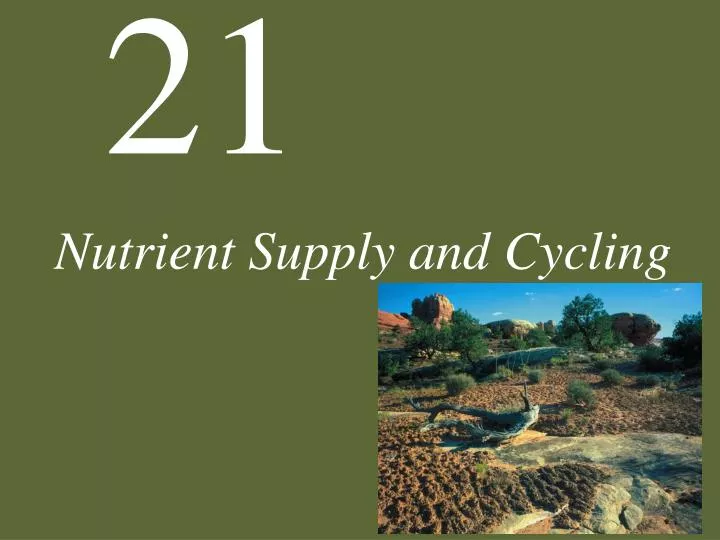
Nutrient Supply and Cycling. 21 Nutrient Supply and Cycling. Case Study : A Fragile Crust Nutrient Cycles and Losses Nutrients in Aquatic Ecosystems Case Study Revisited Connections in Nature : Nutrients, Disturbance, and Invasive Species. Case Study: A Fragile Crust.

E N D
21 Nutrient Supply and Cycling • Case Study: A Fragile Crust • Nutrient Cycles and Losses • Nutrients in Aquatic Ecosystems • Case Study Revisited • Connections in Nature: Nutrients, Disturbance, and Invasive Species
Case Study: A Fragile Crust Soils in the Colorado Plateau in western North America are covered by a biological crust (or cryptobiotic crust)
Case Study: A Fragile Crust Purpose Grazing Recreation
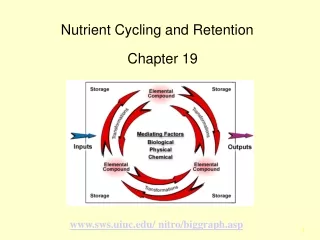
Introduction Biogeochemistry Availability of nutrients
Nutrient Transformations Decomposition releases nutrients as simple, soluble organic and inorganic compounds that can be taken up by other organisms. Fresh, undecomposed organic matter on the soil surface is known as litter.
Nutrient Transformations Chemical conversion of organic matter into inorganic nutrients is called remineralization.
Nutrient Transformations What drives the rate of nutrient transformations?
Nutrient Transformations Carbon chemistry determines how rapidly organic matter can be decomposed. Lignin How would lignin effect decomposition rates?
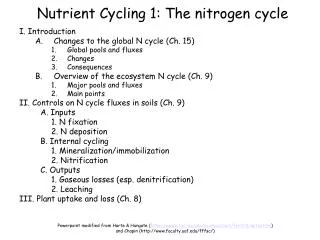
Nutrient Transformations Nitrogen transformations: Nitrification—NH3 and NH4+ are converted to NO3– by chemoautotrophic bacteria, in aerobic conditions. Denitrification—some bacteria use NO3– as an electron acceptor, converting it into N2 and N2O, in anoxic conditions.
Figure 21.11 Nitrogen Cycle for an Alpine Ecosystem, Niwot Ridge, Colorado
Nutrient Cycles and Losses In order to determine nutrient inputs and losses, we must define ecosystem boundaries. For terrestrial ecosystems, a single drainage basin is often used, called a catchment or watershed—the terrestrial area that is drained by a single stream.
Figure 21.15 A Nutrient Limitation of Primary Production Changes with Ecosystem Development
Figure 21.15 B Nutrient Limitation of Primary Production Changes with Ecosystem Development
Figure 21.16 Rivers Are Important Modifiers of Nitrogen Exports (Part 1)
Figure 21.16 Rivers Are Important Modifiers of Nitrogen Exports (Part 2)
Figure 21.16 Rivers Are Important Modifiers of Nitrogen Exports (Part 3)
Nutrients in Aquatic Ecosystems Lakes are classified according to nutrient status: Oligotrophic—nutrient-poor, low primary productivity. Eutrophic—nutrient-rich, high primary productivity. Mesotrophic—intermediate nutrient levels.
Nutrients in Aquatic Ecosystems Over time, the nutrient status of a lake may shift from oligotrophic to eutrophic, called eutrophication. Sediments accumulate over time, and the lake becomes more shallow. Summer water temperatures increase, decomposition increases, and the lake becomes more productive.
Nutrients in Aquatic Ecosystems Human activities accelerate the process of eutrophication by inputs of sewage, detergents, agricultural fertilizers, and industrial wastes. Water clarity in Lake Tahoe has declined because of N and P inputs from neighboring communities.
Figure 21.20 Loss of Biological Crusts Results in Smaller Nutrient Pools
Connections in Nature: Nutrients, Disturbance, and Invasive Species Cheatgrass spring annual increased fire frequency to intervals of about 3–5 years, compared with natural fire frequencies of 60–100 years. Native grasses and shrubs can not recover from these frequent fires, and cheatgrass increases in dominance.
Connections in Nature: Nutrients, Disturbance, and Invasive Species Cheatgrass lowers rates of nitrogen cycling by producing litter with a higher C:N ratio relative to native species.