Download
1 / 24
260 likes | 411 Views
Lecture 10: Map Design. Geography 128 Analytical and Computer Cartography Spring 2007 Department of Geography University of California, Santa Barbara.

E N D
Lecture 10: Map Design Geography 128 Analytical and Computer Cartography Spring 2007 Department of Geography University of California, Santa Barbara
“A graphic depiction of all or part of a geographic realm in which the real-world features have been replaced by symbols in their correct spatial location at a reduced scale.” What is a map? power line
States Transformations Map Making and Map Using Process
Compilation Scale & Projection Data Selection & Conversion Validation Checking Representation Map Type – Dimension & Scaling Design Layout & Cartographic Elements Design Loop Strong interrelationship with Symbol Selection Symbol Selection Map production Symbolization Process
Cartographers have designed hundreds of map types: methods of cartographic representation. Not all GISs allow all types. Most have a set of basic types Depends heavily on the dimension of the data to be shown in the map figure. Choosing a Map Type
Fairly common GIS error. Due to lack of knowledge about cartographic options. Can still have perfect symbolization. Possibility of misinformation Definite reduction in communication effectiveness. Choosing the Wrong Type
Dot Picture Symbol Graduated Symbol Map Types: Point Data
Network Flow Isoline Map Types: Line Data
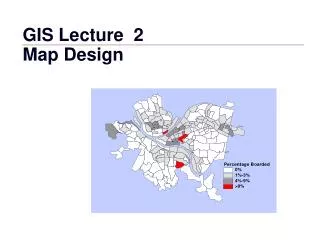
Choropleth Area qualitative Stepped surface Map Types: Area Data
[Isoline, Stepped Surface] Dasymetric Hypsometric Gridded fishnet Hill-shaded Realistic perspective Image map Map Types: Volume Data
Multiple views Animation Moving map Fly thru Fly by Map Types: Time Prediction of urban development to the year 2050 over southeastern Pennsylvania and part of Delaware using the SLEUTH model http://www.essc.psu.edu/~dajr/chester/animation/movie_small.htm
Good map design requires that map elements be placed in a balanced arrangement within the neat line Design Loop Create map layout Draw on screen (proof plot) Look Edit Repeat until happy Make final plot Visual balance is affected by: the "weight" of the symbols the visual hierarchy of the symbols and elements the location of the elements with respect to each other and the visual center of the map Map Design
Shading Hue Pattern Line weight Symbol “Weights”
Visual Center 5% of height 5% of height Portrait Landscape
Title Here Title Here Visual Layout Eye expects (1) balance and (2) alignment
Color is a complex visual variable and in a GIS is specified by RGB or HSI values. Red, Green, Blue are additive primaries. Magenta, Cyan and Yellow are subtractive primaries. Saturation and Intensity map better onto values than hue. Color and Map Design Subtractive Primaries Additive Primaries
HUE SATURATION INTENSITY INTENSITY Dimensions of Color
Simultaneous Contrast http://www.cut-the-knot.org/Curriculum/Geometry/Contrast.shtml
Applications of Analytical Cartography Next Lecture