Download
1 / 30
320 likes | 661 Views
SPM UNIT 4. tOPICS MONITORING AND CONTROL CONTRACT MANAGEMENT. MONITORING AND CONTROL. Monitoring and control cycle. Figure 12.1 Monitoring and control cycle. Responsibilities. Assessing progress. Checkpoints – predetermined times when progress is checked

E N D
SPM UNIT 4 tOPICSMONITORING AND CONTROL CONTRACT MANAGEMENT www.goodwisher.com
MONITORING AND CONTROL www.goodwisher.com
Monitoring and control cycle Figure 12.1 Monitoring and control cycle www.goodwisher.com
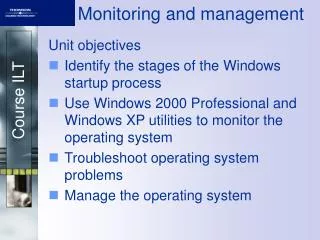
Assessing progress Checkpoints – predetermined times when progress is checked • Event driven: check takes place when a particular event has been achieved • Time driven: date of the check is pre-determined • Frequency of reporting (Taking Snapshots) • The higher the management level, generally, the longer the gaps between checkpoints
Red/Amber/Green (RAG) reporting • Identify key tasks • Break down into sub-tasks • Assess subtasks as: Green – ‘on target’ Amber – ‘not on target but recoverable’ Red – ‘not on target and recoverable only with difficulty’ • Status of ‘critical’ tasks is particularly important
Ball charts Code and test module A 10/10/05 21/10/05 23/10/05 10/10/05 Code and test module B 14/10/05 17/10/05 27/10/05 31/10/05 Code and test module C 17/10/05 17/10/05 27/10/05 27/10/05 Green: On time Red: Missed the target
The timeline Records the way targets have changd throughout the project
Cost monitoring • A project could be late because the staff originally committed, have not been deployed • In this case the project will be behind time but under budget • A project could be on time but only because additional resources have been added and so by over budget • Need to monitor both achievements and costs
Earned value analysis • Planned value (PV) or Budgeted cost of work scheduled(BCWS) – original estimate of the effort/cost to complete a task (compare with idea of a ‘price’) • Earned value (EV) or Budgeted cost of work performed (BCWP) – total of PVs for the work completed at this time
Earned value – an example • Tasks • Specify module 5 days • Code module 8 days • Test module 6 days • At the beginning of day 20, PV = 19 days • If everything but testing completed, EV = 13 days • Schedule variance = EV-PV i.e. 13-19 = -6 • Schedule performance indicator (SPI) = EV/PV i.e 13/19 = 0.68
Earned value analysis – actual cost • Actual cost (AC) is also known as Actual cost of work performed (ACWP) • In previous example, if • ‘Specify module’ actually took 3 days (planned 5 days) • ‘Code module’ actually took 4 days (planned 8 days) • Actual cost = 7 days • Cost variance (CV) = EV-AC i.e. 13-7 = 6 days • Cost performance indicator (CPI) = EV/AC i.e = 13/7 = 1.86 • Positive CV or CPI > 1.00 means project under budget or the work is completed better than planned
Earned value chart with revised forecasts (AC) (PV) (EV)
Prioritizing monitoring We might focus more on monitoring certain types of activity e.g. • Critical path activities • Activities with no free float – if delayed later dependent activities are delayed • Activities with less than a specified float • High risk activities • Activities using critical resources
Getting back on track • Renegotiate the deadline – if not possible then • Try to shorten activities on critical path e.g. • Work overtime • Re-allocate staff from less pressing work • Buy in more staff • Reconsider activity dependencies • Over-lap the activities so that the start of one activity does not have to wait for completion of another • Split activities
Change control The role of configuration librarian: • Identifying items that need to be subject to change control • Management of a central repository of the master copies of software and documentation • Administering change procedures • Maintenance of access records
Typical change control process • One or more users might perceive the need for a change • User management decide that the change is valid and worthwhile and pass it to development management • A developer is assigned to assess the practicality and cost of making the change • Development management report back to user management on the cost of the change; user management decide whether to go ahead
Change control process contd. • One or more developers are authorized to make copies of components to be modified • Copies modified. After initial testing, a test version might be released to users for acceptance testing • When users are satisfied then operational release authorized – master configuration items updated
Change control www.goodwisher.com
Change control and configuration management • Change control • Set of procedures to ensure that changes made only after a consideration of the full impacts. • Configuration management • Version control to ensure that all changes are properly recorded and managed – and so that knock-on effects on other projects can be identified.