Download
1 / 18
240 likes | 1k Views
Heating/Cooling Curve and Phase Diagrams. Heating/Cooling Curve and Phase Diagrams. A heating curve shows how the temperature of a substance changes as heat is added at a constant rate. Heating/Cooling Curve and Phase Diagrams.

E N D
Heating/Cooling Curve and Phase Diagrams A heating curve shows how the temperature of a substance changes as heat is added at a constant rate.
Heating/Cooling Curve and Phase Diagrams The heating curve at right shows the temperature change in a sample of iron as heat is added at a constant rate. The sample starts out as a solid and ends as a gas. • Describe the phase change that occurred between points B and C on the graph. Solution: Between points B and C, the sample changed from solid to liquid.
Heating/Cooling Curve and Phase Diagrams 1. In the heating curve for iron, describe the phase change that occurred between points D and E on the graph.
Heating Cooling Curve and Phase Diagrams 2. Explain why the temperature stayed constant between points D and E.
Heating Cooling Curve and Phase Diagrams 3. What is the melting temperature of iron?
Heating Cooling Curve and Phase Diagrams 4. What is the freezing temperature of iron? How do you know?
Heating Cooling Curve and Phase Diagrams 5. What is the boiling temperature of iron?
Heating Cooling Curve and Phase Diagrams 6. Compare the boiling temperatures of iron and water (water boils at 100°C). Which substance has stronger intermolecular forces? How do you know?
Heating Cooling Curve and Phase Diagrams 7. Between which two points on the graph did freezing occur?
Heating Cooling Curve and Phase Diagrams 8. What is the freezing temperature of stearic acid? What is its melting temperature?
Heating Cooling Curve and Phase Diagrams 9. Compare the melting temperature of stearic acid with the melting temperature of water. Which substance has stronger intermolecular forces? How do you know?
Heating Cooling Curve and Phase Diagrams 10. Can a substance be cooled to a temperature below its freezing point? Use evidence from any of the graphs in this skill sheet to defend your answer.
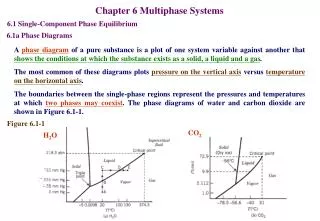
Heating Cooling Curve and Phase Diagrams States of matter are • Solid • Liquid • gas Phase diagrams • pressure-temperature diagrams
Heating Cooling Curve and Phase Diagrams Triple points mark conditions at which three different phases can coexist. For example, the water phase diagram has a triple point corresponding to the single temperature and pressure at which solid, liquid, and gaseous water can coexist in a stable equilibrium
Heating Cooling Curve and Phase Diagrams 1. At what temperature and pressure does H2O exist as a solid, liquid and a gas?
Heating Cooling Curve and Phase Diagrams 2. At 100°C and a pressure above 1.0 atmosphere, H2O exists in which phase of matter?
Heating Cooling Curve and Phase Diagrams 3. At 100°C and a pressure below 1.0 atmosphere, H2O exists in which phase of matter?