Download
1 / 11
110 likes | 197 Views
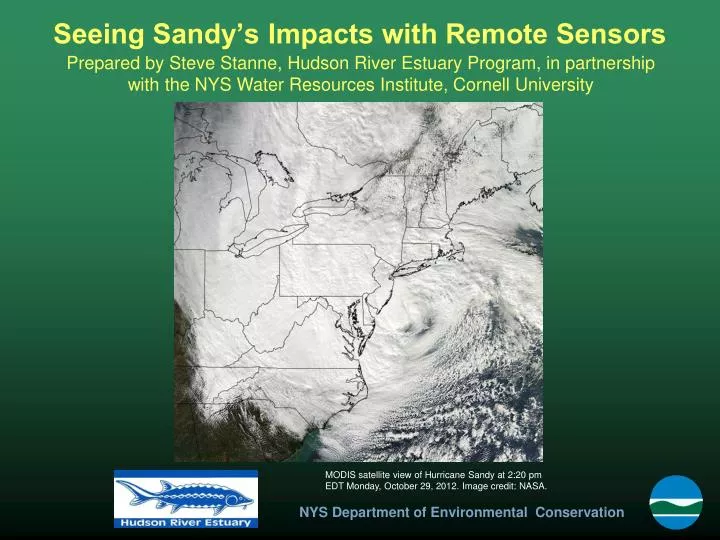
Seeing Sandy’s Impacts with Remote Sensors. Prepared by Steve Stanne, Hudson River Estuary Program, in partnership with the NYS Water Resources Institute, Cornell University. MODIS satellite view of Hurricane Sandy at 2:20 pm EDT Monday, October 29, 2012. Image credit: NASA.

E N D
Seeing Sandy’s Impacts with Remote Sensors Prepared by Steve Stanne, Hudson River Estuary Program, in partnership with the NYS Water Resources Institute, Cornell University MODIS satellite view of Hurricane Sandy at 2:20 pm EDT Monday, October 29, 2012. Image credit: NASA.
Storm surge and wind were responsible for most of the damage caused by Sandy around New York City and in the Hudson Valley. This presentation analyzes what happened using information from instruments on the water that send their data to the World Wide Web. South Ferry subway station, NYC, Tuesday, October 30, 2012. Image credit: MTA
This graph shows water levels at the Battery, Manhattan’s southern tip, during the week before Sandy hit. The ups and downs are high and low tides; zero is the average level of the lowest low tides. The blue line shows predicted tides – the red line, actual tides. The green line gives the difference between the two, caused by weather or other factors. There was little difference between predicted and actual tides in this time period.
This graph shows water levels at the Battery as Sandy approached and hit. The green line - the difference between predicted and actual levels - shows storm surge due to Sandy. How high was it? The red line shows actual levels, combining high tide and storm surge. This is called the storm tide. How high was the storm tide? When did maximum flooding occur?
Troy Albany Port of Albany The Hudson River is an estuary from New York Harbor north past Albany to Troy, 153 miles from the Battery. Tides affect the river all the way to Troy. Do you think that Sandy’s storm surge influenced water levels at Albany, 145 miles north of the Battery? The Battery
This graph shows water levels at Albany as Sandy moved in. Did its storm surge have an impact in Albany? Was there a storm tide? If so, how high did it get? Did it happen at the same time as the storm tide at the Battery?
Storm surge is caused by strong winds and low atmospheric pressure over the ocean. To cause the highest storm surge in New York Harbor, what direction would winds blow from? a) North to East (0-90 compass degrees)? b) East to South (90-180 compass degrees)? c) South to West (180-270 compass degrees)? d) West to North (270-360 compass degrees)? To check your answer, let’s look at data from NOAA buoy 44065 near the entrance to New York Harbor. NOAA Buoy 44065
1400 (2 PM) As Sandy closed in on Monday afternoon,Oct.29, wind direction rapidly shifted from northeast at 1400 Eastern Daylight Time (2 PM) to southeast. (click) Wind speed reached 47 knots (54 miles per hour) around 2000 (8 PM) with gusts (click) to 60 knots (69 mph). This piled water into New York Harbor, causing a record storm tide at the Battery just before 9 PM.
Water fills the Brooklyn-Battery Tunnel , NYC, Tuesday, October 30, 2012. Image credit: MTA Damaged boats at a Hudson River marina,Wednesday, October 31, 2012. The record storm tide devastated low-lying areas along the waterfronts of New York and New Jersey and rolled on up the Hudson, causing severe damage there too.
Thankfully, storms like Sandy don’t come along very often. Next time a nor’easter, hurricane, or other storm impacts the Hudson, New York Harbor, or nearby coastal waters, visit these websites to see what’s going on. In fact, click on these URLs now or any time to check out conditions on the water. 1. NOAA (National Oceanic & Atmospheric Administration) tide gauge at the Battery, New York City: http://tidesandcurrents.noaa.gov/geo.shtml?location=8518750 In the Products column, click on Preliminary Water Level to see graph. 2. NOAA data buoy 44065 in the Atlantic Ocean at New York Harbor entrance: http://www.ndbc.noaa.gov/station_page.php?station=44065 Scroll down the page to view or graph conditions. 3. US Geological Survey Hudson River gages (Albany, Poughkeepsie, links to others): http://ny.water.usgs.gov/projects/dialer_plots/saltfront.html 4. HRECOS (Hudson River Environmental Conditions Observing System) network:http://www.hrecos.org/joomla/ Click on Current Conditions to choose sites and parameters and create graphs. Questions? Contact Steve Stanne, Estuary Education Coordinator for the Hudson River Estuary Program at spstanne@gw.dec.state.ny.us