Download
1 / 59
590 likes | 727 Views
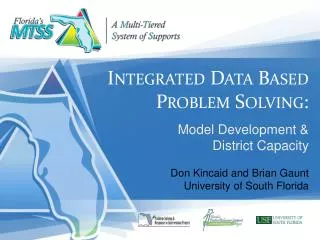
Data-Based Problem Solving and Data Systems. Shelby Robertson, Ph.D. Therese Sandomierski , MA Pamela Sudduth , MA. This Session:. Solidify a vision for problem solving at Tier 1 See some examples of what it looks like for different domains

E N D
Data-Based Problem Solving and Data Systems Shelby Robertson, Ph.D. Therese Sandomierski, MA Pamela Sudduth, MA
This Session: • Solidify a vision for problem solving at Tier 1 • See some examples of what it looks like for different domains • Become familiar with some resources that are available to support DBPS
DBPS Workgroup • Develop a model/template for data-based problem solvingacross tiers… • Can be applied by schools and districts • Primary outcomes will be the conceptual framework, training resources, and exemplarsfor professional development at the district level. • “Library” for consultants
What Is Data-Based Problem Solving? Decisions in a MTSSS Framework are based on student performance data. Data-Based Problem Solving is infused in all components of a MTSSS practice. At the screening level, data would be used to make decisions about which students are at risk of their needs not being met. In the progress monitoring stage, data is used to make decisions about effectiveness of interventions. Decisions to increase or decrease levels of intervention within a Multi-Tiered Systems of Support Framework are based on student performance data.
Why is Data-Based Problem Solving Important? Data-based decisions regarding student response to intervention is central to the MTSSS Framework. Important educational decisions about intensity and likely duration of interventions are based on individual student response to instruction across multiple tiers of interventions and are informed by data on learning rate and level.
Why is Data-Based Problem Solving Important? Knowing why and for what purpose data is being collected is imperative. When the purpose and intent of data collection is known, the data can be used to make various decisions.
What Should Schools Consider? Three types of data are gathered within a MTSSS process: • Data as a result of universal screening is used to identify those students who are not making academic or behavioral progress at expected rates • Data as a result of diagnostic assessment is used to determine what students can and cannot do in important academic and behavioral domains • Data as a result of progress monitoring is used to determine if academic or behavioral interventions are producing desired effects.
Data collection leads to appropriate support and strategic instruction for ALL students. When looking at data, a team may decide: • if the delivery of the core curriculum should be altered, • if more information is needed, • or if supplemental instruction needs to be added. Data that is collected will also inform the school whether or not the problem exists as a result of the classroom environment, intervention, curriculum, instruction, or learner.
Problem Solving Process Define the Problem What Do We Want Students to KNOW and Be Able to DO? Evaluate Did It WORK? (Response to Intervention –RtI) Problem Analysis Why Can’t They DO It? Implement Plan What Are WE Going To DO About It?
Step 1/Tier 1Integrated Guided Questions Guiding Questions: Step 1 – Problem ID • What do we expect our students to know, understand, and be able to do as a result of instruction? • Do our students meet or exceed these expected levels? (How sufficient is the core?) • Are there groups for whom core is not sufficient?
Both domains focus on a common goal: Full Option Graduates!
What do we expect our students to know, understand, and be able to do as a result of instruction? To effectively address student outcomes, schools must address both domains.
How to Answer the Questions: Behavior • Attendance • Tardies • Suspensions • Discipline referrals • Surveys • Locally developed, safety, climate, substance abuse • Percent participating in Tier 1 system
How sufficient is the core? www.swis.org
Are there groups for whom core is not sufficient? www.flrtib.org
Are there groups for whom core is not sufficient? www.flrtib.org
Step 2/Tier 1 Integrated Guided Questions Guiding Questions: Step 2 – Problem Analysis • If the core is NOT sufficient for either a “domain” or group of students, what barriershave or could preclude students from reaching expected levels?
Alignment with Standards and Across Grade/School Levels, Relevancy to Students’ Personal Goals, Content, Pacing, Progression of Learning, Differentiation Reinforcement Preferences, Perceptions of Competence and Control, Perceived Relevancy of Instruction/Education, Integration and Affiliation with School, Academic/Social-Emotional Skill Development Cognitive Complexity of Questions and Tasks, Gradual Release of Responsibility, Appropriate Scaffolding, Connection to Students’ Personal Goals, Interests and Life Experiences Reward/Consequence System, Visual Cues, Climate/Culture, Quality of Student/Adult Relationships, Quality of Peer Relationships, High Expectations for ALL Students, Collaboration and Voice
Reaching Expected Levels • If the core is NOT sufficient for either a “domain” or group of students, what barriers have or could preclude students from reaching expected levels?
What potential barriers have precluded us from improving student outcomes? Lack of… • Common Assessments • Common Planning • Ongoing Progress Monitoring • Curriculum Mapping Aligned with NGSSS and Common Assessments • Resource Availability • Administrative Support • Professional Development
The school-wide reinforcement program IS NOT being implemented with fidelity…
Step 3/Tier 1 Integrated Guided Questions Guiding Questions: Step 3 – Plan Development & Implementation • What strategies or interventions will be used? • What resources are needed to support implementation of the plan? Planning for Step 4 • How will sufficiency and effectiveness of core be monitoredovertime? • How will the data be displayed? • How will fidelityof interventions be monitored over time? • How will fidelity of the problem solving process be monitored over time? • How will “good”, “questionable,” and “poor” responses to intervention be defined?
Math Resources • What resources are needed to support implementation of the plan?
Literacy Resources • What resources are needed to support implementation of the plan?
http://www.flrtib.org http://flpbs.fmhi.usf.edu
Tier 1 Interventions (Behavior) Based on the function of the problem behavior • Teach the skill • Reward the skill • Consequate effectively • Referrals by expectation, context, motivation, admin decision will help inform the possible function • www.flpbs.fmhi.usf.edu for examples
How will sufficiency and effectiveness of core be monitored overtime? • Common Assessment Example
Monitoring the Core (Behavior): Referrals per Day/Month www.flrtib.org
How will fidelity be monitored over time? • Fidelity of implementation is the delivery of instruction in the way in which it was designed to be delivered. • Fidelity must also address the integrity with which screening and progress-monitoring procedures are completed and an explicit decision-making model is followed. • Fidelity also applies to the problem solving process…bad problem solving can lead to bad decisions to implement otherwise good interventions.
Monitoring the Core (Behavior):Fidelity • Depends on the intervention! • Lesson plans with built-in fidelity checklists • Permanent products of lessons • Token sign-out logs • Counts of positive post cards • Parent call logs • Implementation measures • Surveys, focus groups observations
How will “good”, “questionable,” and “poor” responses to intervention be defined? Decision Rules: • Positive Response • Gap is closing • Can extrapolate point at which target student(s) will “come in range” of target--even if this is long range • Questionable Response • Rate at which gap is widening slows considerably, but gap is still widening • Gap stops widening but closure does not occur • Poor Response • Gap continues to widen with no change in rate.
Defining Adequate Response: Tier 1 for Behavior • School-Wide screenings (< 20% identified) • ODRs by October (< 2 majors) • Teacher nominations, ESE (EBD) referrals • Declining trend* in discipline data • Attendance, tardies
Step 4/Tier 1 Integrated Guided Questions Step 4 – Plan Evaluation of Effectiveness • Have planned improvements to core been effective?
Gap is closing, Can extrapolate point at which target student(s) will “come in range” of target--even if this is long range Positive Response to Intervention Expected Performance Performance Observed Performance Fall Winter Spring
Positive Response to Intervention Expected Trajectory Performance Observed Trajectory Time
Rate at which gap is widening slows considerably, but gap is still wideningGap stops widening but closure does not occur Questionable Response to Intervention Expected Performance Performance Observed Performance Fall Winter Spring
Questionable Response to Intervention Expected Trajectory Performance Observed Trajectory Time
Gap continues to widen with no change in rate. Poor Response to Intervention Expected Performance Performance Observed Performance Fall Winter Spring
Poor Response to Intervention Expected Trajectory Performance Observed Trajectory Time