Download
1 / 53
530 likes | 641 Views
EASTERN EUROPE & How to best approach this market. Samuel Vetrak, CEO StudentMarketing Ltd May 2nd, 2011. --------------------------------------------------------------------- With special attention to K-12 sector. How to best approach Eastern Europe. Research and development : .

E N D
EASTERN EUROPE & How to best approach this market Samuel Vetrak, CEO StudentMarketing Ltd May 2nd, 2011 --------------------------------------------------------------------- With special attention to K-12 sector
How to bestapproachEasternEurope Research and development: Knowing trends helps you identify opportunities, design thorough strategy and compete successfully. Good marketing decisions guided by market research lead to 25% - 50% increase in revenues within 3 years. Sources: D.Smith , J.H. Fletcher: The Art & Science of Interpreting Market Research Evidence
How to best approach Eastern Europe Outline • K-12 global student mobility • Eastern Europe • Agent market • How to best approach this market
K-12 globalstudent mobility Definitionof K-12 Is a designation for the sum of primary and secondary education. Internationally, it is often understood as educational travel. The expression K-12 is a shortening of Kindergarten through 12th grade (16-19 years old). It is often used in USA, Canada and Australia. Statistically, K-12 global international student mobility is measured on secondary level only or data for primary level are not measured separately. Source: Macmillan Dictionary, CAPS-I, Australian Human Rights Commission, Whatis.com
K-12 globalstudent mobility Percentageofchange in theyouthtravelsectors 10 YTD Increase in % of change 23% 58% 71% 22% 32% 29% 31% K-12 sector has not been affected by ecomonic downturn as much as some other sectors. Sources: UNESCO, LTM, OECD, CAPS-I, CSIET, Citizenship and immigrationCanada, MinistryofEducation NZ, BritishBoardingSchools, AustralianEducationInternational
K-12 globalstudent mobility Numbers of international K-12 students in last 10 years K-12 sector is globally increasing its numbers with 35% 10YTD growth. Sources: UNESCO, LTM, OECD, CAPS-I, CSIET, Citizenship and immigration Canada, Ministry of Education NZ, British Boarding Schools, Australian Education International
K-12 globalstudent mobility Numbers of international K-12 students by receiving destinations 2008 USA 25% Australia 24% UK 18% Canada 17% New Zealand 14,5% 2009 USA 25% Australia 24,5% UK 19% Canada 16% New Zealand 15% Total number of international K-12 students is estimated to be above 120,000. Sources: UNESCO, LTM, OECD, CAPS-I, CSIET, Citizenship and immigration Canada, Ministry of Education NZ, British Boarding Schools, Australian Education International & extrapolated data
K-12 globalstudent mobility Marketshares in K-12* Canada is one of the strongest K-12 destinations, but its market share is decreasing (1.9% in 3 years). * Calculated from total number of major international K-12 destinations where data available (2009). Sources: UNESCO, LTM, OECD, CAPS-I, CSIET, Citizenship and immigration Canada, Ministry of Education NZ, British Boarding Schools, Australian Education International & extrapolated data
K-12 globalstudent mobility Numbersand market shares ofUSA Number of total students in 2010 was 9,0% higher than in 2005, 12,6% higher than in 2003. Source: Statistics on Semester and Year Programs, The Council on Standards for International Educational Travel
K-12 globalstudent mobility Numbersand market shares ofAustralia Number of total students in 2009 was 9,6% higher than in 2005. Sources: Australian Education International
K-12 globalstudent mobility Numbersand market shares of UK Number of total students in 2010 was 18,1%higher than in 2005, and 37,4%higher than in 2000. Sources: Independent Schools Council, British Boarding Schools Workshop
K-12 globalstudent mobility Numbersand market shares of New Zealand Number of total students in 2010 was 52,1%higher than in 2005, and 19,5%higher than in 2002. Sources: Ministry of Education of New Zealand
K-12 globalstudent mobility Numbersand market shares ofCanada Number of total sutdents in 2009 was 8,9% higher than in 2005, and 5,5%higher than in 2000. Source: Citizenship and Immigration Canada, CAPS-I & extrapolated data
K-12 globalstudent mobility K-12 mobility and market shares in last 10 years Overall revenues generated internationally in K-12 sector are estimated to be cca 1.5 bn. K-12 sector is globally increasing its numbers, whereas Canada‘s market share is decreasing. Sources: UNESCO, LTM, OECD, CAPS-I, CSIET, Citizenship and immigration Canada, Ministry of Education NZ, British Boarding Schools, Australian Education International
K-12 globalstudent mobility International K-12 students by sending regions TOP Sending countries: China, South Korea, Taiwan, Hong Kong, Germany Eastern Europeis already sending more K-12 students than Latin America. Sources: UNESCO, LTM, OECD, CAPS-I, CSIET, Citizenship and immigration Canada, Ministry of Education NZ, British Boarding Schools, Australian Education International & extrapolated data
K-12 globalstudent mobility • Conclusions • K-12 represents cca120.000 students & 1.5 bn (18.319 & 300m in Canada) • K-12 sector is growing more steadily than other sectors • Canada is not gaining as much as some other destination • Canada’s market share is actually descreasing (1.9% in 3 years) • Eastern Europe is already sending more K-12 students than Latin America
Eastern Europe Market features • Multinational diversified region • Economically growing market • Interest in English learning • Increasing demand for education abroad • Sending more K-12 students than Latin America • Price sensitive • Demand for USA/North America • Agents are predominant booking channel
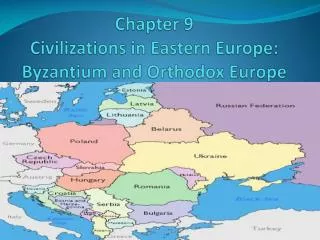
Eastern Europe 450m population 29 countries 18 languages 6% K-12 market share 770.000 int students 2.600 stu agencies 228 K-12 agencies Poland, Czech Republic, Hungary, Slovakia, Belarus, Russia, Ukraine, Estonia, Latvia, Lithuania, Croatia, Slovenia, Albania, Serbia, Bosnia a Herzegovina, Montenegro, Macedonia, Romania, Bulgaria, Romania, Georgia, Armenia, Azerbaijan, Kazakhstan , Kyrgyzstan, Turkey, Tajikistan, Armenia, Moldova, Turkmenistan, Uzbekistan
Eastern Europe Purchasing power (K-12 Index) – sending countries Eastern Europe Western Europe Similar to BigMac Index: number of working days one has to work for average wage to buy High School in Canada. The lower the column is, the stronger the buying power is. Sources: Laborstats – ILO, 2010
Eastern Europe Purchasing power (K-12 Index) Purchasing power doubles in Eastern Europe, Eastern European can afford twice more than in 2000. Sources: Labostats - ILO
Eastern Europe TOP 100 Most expensive cities in the world (Economist Intelligence Unit) • 4. London (UK) • ..... • 18. Sydney (Australia) • 24. Melbourne (Australia) • New York (USA) • 29. Manchester (UK) • 34. Vancouver • 36. Chicago (USA) • 36. Montreal 39. Los Angeles (USA) 40. Perth (Australia) 41. Brisbane (Australia) 41. San Francisco (USA) 43. Toronto 44. Washington (USA) Canadian destinations are more affordable than competitive destinations. Source: Economist
Eastern Europe Market demand for education abroad LanguageTravel HigherEducation K-12 Market demand for education abroad is increasing in Eastern Europe, the region is becoming extremely important in the global student market and offers unique opportunity in upcoming years.
Eastern Europe Demand for English in Europe (incl. Eastern Europe) Eastern European countries increase their English knowledge faster then some in Western Europe. The increase is within young generation, their need and learn English more than their parents.
Eastern Europe International K-12 students by sending regions Eastern Europeis already sending more K-12 students than Latin America. Sources: UNESCO, LTM, OECD, CAPS-I, CSIET, Citizenship and immigration Canada, Ministry of Education NZ, British Boarding Schools, Australian Education International & extrapolated data
Eastern Europe Averageprices in EasternEurope (K-12 receivingdestinations) (in CAD; ECB April 20th 2011) Price is an important factor for parents when making purchasing decisions. Source: StudentMarketing 2011
Eastern Europe Averageprices in EasternEurope (K-12 receivingdestinations) (in CAD) Source: StudentMarketing 2011. On the basis of the offer of Eastern European agents. The prices are in average. They may vary due accommodation type (homestay/residence)and the school type (private/public).
Eastern Europe Average prices in Europe (High School in Canada) (in CAD) Eastern Europe is still more price sensitive region than Western Europe (across sectors). Source: StudentMarketing 2011
Eastern Europe TOP K-12 destinations in Eastern Europe Eastern Europeans are traditionally interested in USA, USA as K-12 however sometimes does not meet the demand from Eastern Europe. Source: StudentMarketing 2011
Eastern Europe Importance of agents "Parents of prospective students often require the services of an agent to ensure they get exactly what they are looking for. “In some of these countries,” asserts Declan Millar at High Schools International, which places students in high schools in Ireland, the UK, Australia, the USA and Canada, “clients do not have the expertise or experience to make good informed choices and depend on agencies for this and for visa guidance. They also depend on local agents for progression guidance to universities.”
Eastern Europe • Importance of agents • Eastern Europe has similar booking habits to other markets • Almost all K-12 bookings come from agents (industry experience, no data available) • Trend similar to other junior levels in educational sectors (language, jugendreisen, etc.) • Parents need agents due trust, orientation, paperwork, problemsolving, etc. • Online shopping is not increasing in educational travel ama in other sectors • Online presence however is important (cca 60-80% check before visiting stone office)
Eastern Europe • Conclusions • Eastern Europe represents 29 countries (nationality mix) • Eastern Europeans have now 2 times stronger purchasing power than in 2000 • Eastern Europe is growing and already sending more K-12 students than Latin America • Canadian schools could gain from limited supply in USA • Canadian schools could benefit from sensitive price strategy • Canadian schools should approach agents as the most important channel
Agents in Eastern Europe There are 29 countries and 2600 youth and studenttravel agents. Agent market is maturing, but there are still mostly small agencies. Average sending numbers per agent is 258. Schools need to be prepared to work with several agencies in region. To maintain effort and overheads, educators need to be selective what agents to work with. Features of agents or how to qualify agencies: - Age/Experience - Portfolio - Offices/Counsellors - Sending numbers - Price levels - Workshop attendance - Credentials / Association membership Source: StudentMarketing 2011
Agents in Eastern Europe Profile ofagents by experience/age Agent market is maturing, not so many new agencies, market is taken by old agencies who have made to buid their market position. These agencies are the best targets to make representatives. Source: StudentMarketing 2011
Agents in Eastern Europe Profile of agents by portfolio (number of sectors they promote) EE agents are more diversified, their promote more programs/sectors than agents in Western Europe or Asia. It is an attribute Canadian schools could use for their benefit. Source: StudentMarketing 2011
Agents in Eastern Europe Profile of agents by number of inter/national offices EE agencies are usually small operations and have no more then 1 office. Canadian schools need to be prepared to work with several representatives in order to cover the region or countries like Russia. Source: StudentMarketing 2011
Agents in Eastern Europe Profile of agents by number of students administered by one employee Most EE agents have qualified and sufficient personel to provide high level of consultancy and customer service the parents and youngsters require. Source: StudentMarketing 2011
Agents in Eastern Europe Profile of agents by number of students administered by one office Most EE agents still offer in person customer service in their offices, it is also one of the reasons why the market is broken down to many small agencies. Source: StudentMarketing 2011
Agents in Eastern Europe Profile of agents by sending numbers Even though Eastern Europe as a region represents a significant sending region, most agents in Eastern Europe do not send high number of international students. Source: StudentMarketing 2011
Agents in Eastern Europe Profile ofagents by pricelevels • There are various financial • methods in between educationalinstitution and educational agency: • Gross prices/Commission • Gross prices/Agency Fee • Net Prices • - other Eastern Europe is still very price sensitive and most agents need to adjust the price (only 25% of agencies promote they products for an average price). Source: StudentMarketing 2011
Agents in Eastern Europe Profile of agents by workshop attendance K-12 agents who have attended educational b2b workshops in the past 3 years. There are dozens of b2b workshop opportunities in Educational Travel: ALPHE UK StudyWorld WYSTC ALPHE Russia ICEF Berlin BBSW ICEF Moscow ALPHE Istanbul .... Regarding agent attendance, workshops are one of the best occasions where CAPS-i or individual Canadian schools could build their profile and get new agent partners. Source: StudentMarketing 2011
Agents in Eastern Europe Profile of agents by association membership • There are 110 agent associations worldwide, and dozens in Eastern Europe, that track quality of agencies: • AREA • TEAG • UED • etc. K-12 agents who are members of association. For CAPS-i or individual Canadian schools, agent associations represent a unique opportunity to increase their profile and open leads to new agent partners. Source: StudentMarketing 2011
Agents in Eastern Europe BEST agents in Eastern Europe Using previousunderstanding and profiling agents, identification of the most suitablequalityagenciescanbe done as mentionedherein (sample pictureonly). Source: StudentMarketing 2011
Agents in Eastern Europe • Conclusions • Agent market is maturing, but still many small agencies in region • 2.600 agencies in 29 countries • Educators need to be selective what agents to work with • There are up to 20 criteria educators can consider • 228 K-12 agents and 800 edu agents (LT & HiEd) in Eastern Europe • Selective approach enables educators to establish agent relationships effectively
How to bestapproachEasternEurope • Approach • Educational value – emphasize academic value in comparison to other destinations • Translations – to ease understanding for ultimate decision makers/parents • Competitive price – individually by market • Focus on agents – agents are predominant channel • Be selective what agents to work with (out of 2.600) • Individual educator: attend workshops; followed by sales trips • Association: Branding at associations, workshops, trade mission; followed by FAM trip
How to bestapproachEasternEurope Educational value Canadian schools could benefit from emphasizing academic value and how it can lead students to first rate colleges and universities (as othet schools and study destination do actively). For Eastern European market, it is important to present it in major local languages as ultimate decision makers do not speak English. It represents a significant competitive advantage. Source: StudentMarketing 2011
How to bestapproachEasternEurope Competitive price (in CAD) Should it be within possibility, competitve pricing and interactive pricing approach are relevant. Source: StudentMarketing 2011, Caps-I
How to bestapproachEasternEurope Potential agent partners K-12 agents bydestinations 57,4% of High School agents do not promote Canada and represent an opportunity for Canadian schools to have fast approach to experienced agencies with existing outreach. Source: StudentMarketing 2011
How to bestapproachEasternEurope Potential agent partners K-12 Agents by sectors 91% out of 2600 agents in Eastern Europe do not promote High School programs. Agents promoting Language and Higher Education represent an opportunity for Canadian schools. Source: StudentMarketing 2011
How to bestapproachEasternEurope • Potential agent partners - approach channels • EVENTS • Workshops • Trade missions • Recruitment trips • FAM Trip • ACTIVITIES • Educational Fairs • Webinar / Online Training • Online direct presentation Best selection and succession of these agents-to-reach depend on subject (association, individual school), current status, objectives and budgets of particular institution.