Download
1 / 17
170 likes | 269 Views
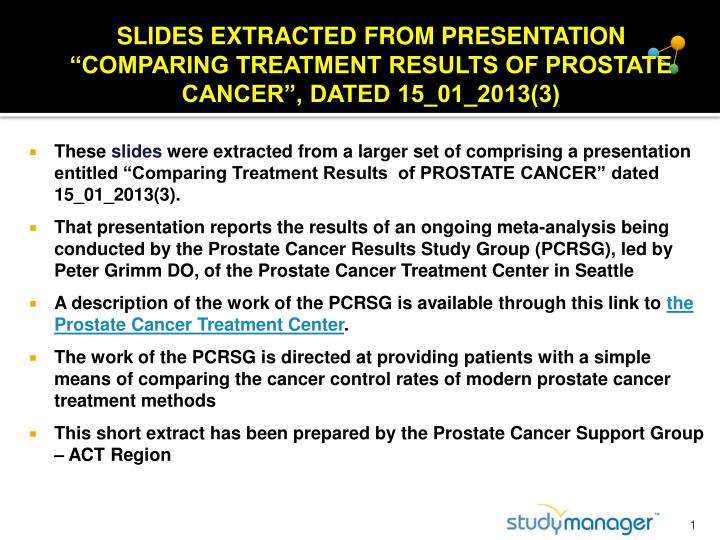
SLIDES EXTRACTED FROM PRESENTATION “COMPARING TREATMENT RESULTS OF PROSTATE CANCER”, DATED 15_01_2013(3). These slides were extracted from a larger set of comprising a presentation entitled “Comparing Treatment Results of PROSTATE CANCER” dated 15_01_2013(3).

E N D
SLIDES EXTRACTED FROM PRESENTATION “COMPARING TREATMENT RESULTS OF PROSTATE CANCER”, DATED 15_01_2013(3) • These slides were extracted from a larger set of comprising a presentation entitled “Comparing Treatment Results of PROSTATE CANCER” dated 15_01_2013(3). • That presentation reports the results of an ongoing meta-analysis being conducted by the Prostate Cancer Results Study Group (PCRSG), led by Peter Grimm DO, of the Prostate Cancer Treatment Center in Seattle • A description of the work of the PCRSG is available through this link to the Prostate Cancer Treatment Center. • The work of the PCRSG is directed at providing patients with a simple means of comparing the cancer control rates of modern prostate cancer treatment methods • This short extract has been prepared by the Prostate Cancer Support Group – ACT Region
23,000+ prostate studies were published between 2000 and 2012 989 of those studies featured treatment results 195 of those met the criteria to be included in this review study. (*1st & 2nd group) Some treatment methods are under-represented due to failure to meet criteria ABOUT THIS REVIEW STUDY
Criteria for Inclusion of Article* * Expert panel consensus Patients should be separated into Low, Intermediate, and High Risk Success must be determined by PSA analysis All Treatment types considered: Seeds (Brachy), Surgery (Standard or Robotic), IMRT (Intensity Modulated Radiation), HIFU (High Frequency Ultrasound), CRYO (Cryo Therapy), Protons, HDR (High dose Rate Brachytherapy) Article must be in a Peer Reviewed Journal 3
Criteria for Inclusion of Article (cont.) 5. Low Risk articles must have a minimum of 100 patients 6. Intermediate Risk articles must have a minimum of 100 patients 7. High Risk articles, because of fewer patients, need only 50 patients to meet criteria 8. Patients must have been followed for a median of 5 years For additional criteria information contact: lisa@prostatecancertc.com 4
% Articles Meeting Criteria Total of 989 Treatment Articles. Some articles addressed several treatments and were counted as separate articles for each treatment. *A few articles evaluated other/minor treatments and are not listed here. These calculations only include primary accepted articles, and do not include secondary acceptance totals. 5
“Strict criteria” = studies that meet the criteria specified in earlier charts “Relaxed criteria” = studies that met the strict criteria PLUS studies which: (a) relate to to patients for whom there is only 40 to 59 months of follow-up (instead of 5 years or more), or (b) relate to low risk or intermediate risk patients with 5 years or more of follow-up but with less than 100 patients, or (c) relate to high risk patients with 5 years or more of follow-up but with less than 50 patients “Weighted” means that the ellipses shown have taken into account the numbers of patients in each study EXPLANATORY NOTES FOR FOLLOWING SELECTED CHARTS
Each treatment is given a symbol. For example Seed implant alone (Brachy) is given a blue dot with a number in it. The number in the symbol refers to the article. The article can be found in the notes section below the slide ( go into “view” in up left corner of PowerPoint and click on note section, then click on this portion and scroll down to see all the references) Treatment Success % = Percent of men whose PSA numbers do not indicate cancer progression. (progression free) at a specific point in time The bottom line indicates the number years the study is out An example, the blue dot with 27 inside indicates that, as per article 27, 97% of the patients treated with seeds alone in low risk patients at 12 years were free of disease progression according to PSA numbers How to Interpret the Results -1 27
First Establish your clinical risk group* by looking at the definitions or ask your physician Refer only to those slides for your risk group Make your own judgment and then ask a doctor in each discipline ( Seeds, External Radiation Surgery, etc) to tell you where his/her own peer reviewed publishedTreatment Success % would fit on this plot. How to Interpret the Results - 2 *Next Slide
Risk Group Definitions Low Risk Stage: T1 or T2a,b Gleason Sum < 6 PSA < 10 ng/ml • Intermediate Risk • Stage T1 or T1-2 Stage T1-2 • Gleason Score 7 or Gleason 6 • PSA < 10 PSA 10-20 High Risk Stage T2c or T3 Gleason score ≥ 8 PSA > 20 ng/mL
LOW RISK RESULTS – STRICT CRITERIA Weighted Brachy % PSA Progression Free 23 14 21 27 EBRT 25 13 8 4 22 37 35 6 30 17 3 33 32 10 39 103 31 29 101 28 18 EBRT & Seeds 102 24 38 36 5 16 19 2 26 12 40 1 100 Robot RP 106 7 107 104 9 108 15 Treatment Success Surgery CRYO HIFU 34 Protons ← Years from Treatment → HDR 11 • Prostate Cancer Results Study Group • Numbers within symbols refer to references Prostate Cancer Center of Seattle
LOW RISK RESULTS – RELAXED CRITERIA Weighted EBRT Brachy % PSA Progression Free 68 51 50 46 92 96 23 14 21 Seeds & ADT 97 27 66 25 + 22 13 8 48 4 75 62 37 81 44 86 35 6 17 30 82 3 EBRT & ADT 60 69 41 71 33 32 10 65 85 39 103 Treatment Success 84 31 72 99 29 101 28 67 98 89 42 94 95 61 93 18 88 EBRT& Seeds 102 24 38 73 54 36 5 16 19 47 78 43 2 26 12 64 55 52 40 83 58 Robot RP 1 100 87 106 7 107 76 56 104 77 9 108 70 80 41 15 45 57 74 79 59 Surgery 53 90 CRYO 63 HIFU 34 Protons ← Years from Treatment → Hypo EBRT 91 49 HDR 11 • Prostate Cancer Results Study Group • Numbers within symbols refer to references Prostate Cancer Center of Seattle
INTERMEDIATE RISK RESULTS – STRICT CRITERIA Weighted EBRT & Seeds Brachy % PSA Progression Free 33 24 Robot RP 13 23 37 14 35 49 Seeds + ADT 151 34 + 44 15 40 16 4 32 EBRT & Seeds 38 30 36 45 39 31 6 12 Hypo EBRT 42 3 43 27 17 18 Seeds Alone 28 150 5 26 19 9 Treatment Success 7 25 29 41 1 48 2 8 10 11 46 EBRT Surgery 20 HDR EBRT, Seeds + ADT ← Years from Treatment → 21 Protons 22 • Prostate Cancer Results Study Group • Numbers within symbols refer to references Prostate Cancer Center of Seattle
INTERMEDIATE RISK RESULTS – RELAXED CRITERIA WEIGHTED Brachy % PSA Progression Free EBRT + ADT 54 56 59 104 33 24 Robot RP 13 66 55 23 37 14 EBRT 79 35 49 92 98 Seeds + ADT 151 34 + 15 44 96 40 EBRT & Seeds 57 16 4 32 38 109 36 68 69 58 30 45 99 77 12 39 83 31 105 107 82 97 6 73 Hypo EBRT 42 106 108 51 91 3 64 43 72 27 62 63 93 86 71 17 Seeds Alone 18 50 81 95 28 150 74 67 90 26 19 5 9 52 78 65 Treatment Success 70 7 25 103 102 29 41 76 60 100 1 48 2 85 88 53 8 87 10 75 101 11 46 84 94 Surgery 89 20 HDR EBRT, Seeds + ADT ← Years from Treatment → 21 Protons 80 22 • Prostate Cancer Results Study Group • Numbers within symbols refer to references Prostate Cancer Center of Seattle
HIGH RISK RESULTS – STRICT CRITERIA Weighted EBRT, Seeds & ADT % PSA Progression Free Brachy 20 16 109 45 Surg & ADT 19 18 4 108 EBRT & ADT 112 38 22 17 EBRT & Seeds 40 112 37 3 43 47 Hypo EBRT 34 32 44 2 41 104 9 28 48 10 13 36 114 42 24 1 12 8 25 Treatment Success 110 101 106 5 113 21 111 33 118 14 121 119 39 Surgery 117 115 26 11 EBRT 103 7 6 35 Protons 116 31 30 27 46 107 HDR 15 102 105 EBRT Seeds + ADT 29 23 ← Years from Treatment → 49 Robot RP • Prostate Cancer Results Study Group • Numbers within symbols refer to references Prostate Cancer Center of Seattle
HIGH RISK RESULTS – RELAXED CRITERIA WEIGHTED Brachy % PSA Progression Free 92 65 20 16 109 81 Surg & ADT 45 19 18 80 4 108 74 EBRT & ADT 112 78 38 22 Treatment Success 17 67 EBRT & Seeds 55 75 112 40 37 3 72 85 43 76 47 Hypo EBRT 60 54 34 32 44 91 66 2 41 104 9 79 68 57 28 10 48 71 64 59 114 13 36 42 24 50 56 1 12 8 53 25 61 90 89 110 101 EBRT 5 113 21 111 62 106 33 118 14 119 70 39 115 26 11 103 83 82 7 6 35 Protons 52 63 84 116 31 30 73 58 27 46 77 HDR 107 86 87 15 102 88 105 51 EBRT Seeds + ADT Surgery 29 23 ← Years from Treatment → 49 69 Robot RP HIFU • Prostate Cancer Results Study Group • Numbers within symbols refer to references Prostate Cancer Center of Seattle
OBSERVATIONS For most low risk patients, most therapies will be successful. There appears to be a higher cancer control success rate for Brachy over EBRT and Surgery for all groups. Patients are encouraged to look at graphs and determine for themselves Serious side effect rates must be considered for any treatment Relaxing the report selection criteria doesn’t seem to impact the results substantially 16
For More Information Peter Grimm, DO peter@grimm.com Lisa Grimm, Research Coordinator lisa@prostatecancertc.com Or ProstateCancerTC.com Or contact PCRSG member Prostate Cancer Treatment Center website www.Prostatecancertreatmentcenter.com