Download
1 / 51
510 likes | 698 Views
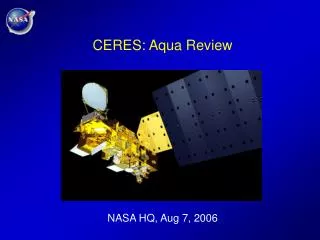
CERES Status Bruce A. Wielicki NASA Langley Research Center Aqua Status Meeting NASA HQ, Aug 23, 2005. CERES Summary: New Science.

E N D
CERES StatusBruce A. WielickiNASA Langley Research CenterAqua Status MeetingNASA HQ, Aug 23, 2005
CERES Summary: New Science • Large variability in Global Ocean Heat Storage and ERBS/CERES global net radiative fluxes agree to within 0.4 Wm-2 (1s) for 1992-2002. (included in IPCC AR4 and submitted to J. Climate) • Earthshine albedo change reported in Science, 2004 • Earthshine claims 6 Wm-2 increase in reflected flux 2000 to 2003 • CERES claims 1 Wm-2 decrease (Wielicki et al., Science, May 2005) • Have engaged Earthshine authors for direct CERES/Earthshine comparison: expect Earthshine aliasing and sampling errors large • GEWEX international Radiative Flux Assessment is underway • Co-chaired by Wielicki, Stackhouse, Raschke, Ohmura • TOA and Surface flux assessment of decadal change/uncertainties • First draft in late 2005, final in late 2006. Relevant to IPCC AR4. • CERES data and validation results are major contributions. • New approach to cloud model testing: CERES cloud properties/radiative fluxes versus Cloud Resolving Models and ECMWF global model (Xu et al., J.Climate July 2005). • CERES/MODIS and ISCCP tests of climate model cloud properties (Zhang et al., JGR, May 2005, likely IPCC AR4).
Ocean Heat Storage vs. Satellite Radiation Data Recover ERBS Nov 99 - Aug 05 by allowing for 15 degree tilt angle change Wong et al., submitted to J. Climate
CERES rejects Earthshine 6% albedo anomaly Aqua Terra 2000 2003 2004 2005 2001 2002
CERES Summary: New Science • AMS BAMS publication of NASA/NIST/NPOESS Satellite Climate Calibration Report, Sept 2005. • SW/LW/Net flux goals of 0.3/0.2/0.3 Wm-2 per decade (0.1 - 0.3%) • Stackhouse completing FlashFlux using CERES code: • near real-time version (3-4 days after acquisition) of CERES level 3 gridded TOA/Surface fluxes • lower accuracy sufficient for use in seasonal to interannual prediction: constrain ocean surface fluxes on weekly basis • Mlynczak has begun a combined CERES-AIRS isolation of the far-infrared (15 to 100 micron wavelengths): unexplored and dominates the water vapor greenhouse effect. • CERES is now engaging the major climate modeling groups in comparisons of new cloud/radiation data • new Multi-Model Framework (CSU, LaRC, GSFC effort) • new CERES cloud objects & 4-D weather forcing data now online • standard climate model statistics including seasonal cycles • new concepts like Perturbed Physics Ensembles • New A-train subset of CERES/MODIS/CALIPSO/Cloudsat along the active sensor profile (60km swath) in development (NEWS)
CERES Summary: Aqua Data Products • CERES Science Team Meeting May 2005, GFDL Princeton. • Engage GFDL climate modelers • Next meeting will be Nov 1-3 at LaRC • Aqua Level 1 Radiances and ERBE-Like TOA Fluxes • Nominal production of Ed1 and Ed2 data products (avail to April 2005) • Rev 1 for RAP vs Crosstrack scan SW cal change in Data Quality Summary • Rev 2 will provide scene type dependence of SW change (Nov 2005) • Aqua Level 2 TOA, Surface, and Atmosphere Fluxes, ADMs • Edition 1 SSF (merged MODIS cloud/CERES) in production using Terra ADMs for first processing. • 2 years of Aqua SSF Ed1 used to produce Aqua ADMs • Expect Aqua ADMs complete/validated/approved at Nov 2005 meeting. • Dec 2005 Aqua Ed2 processing begins with new Aqua ADMs, in time for merging with CALIPSO and Cloudsat on the A-train. • Full 3 years of Aqua L2 (TOA to Surface fluxes) in archive by Summer, 2006. • Aqua Level 3 products • Once ADMs are complete, these will lag level 2 reprocessing by about 1 month.
What are CERES Next Steps? • Completing CERES constraint of geo shortwave diurnal cycles • correcting time/angle differences in 1 degree monthly grid box • Closing the global net energy budget to from 5 Wm-2 to 1 Wm-2 • solar constant (1), ocean heat storage (1), diurnal (3?), cal (2). • Completing studies of interannual variations of global albedo, LW flux, and Net flux • RAP vs Crosstrack scanner comparisons have been critical • Using Terra FM2 CERES to test scan mode contam effects: so far appears to be only RAP mode: no effect on normal crosstrack. • Completing 3-hourly synoptic and monthly average products • Validation against GERB diurnal cycles • CERES will serve as GERB SW reference, GERB as diurnal cycle • Validation against A-train aerosol/cloud profiles: esp. polar • Improving polar ADMs (3x larger errors than other regions) • Merging with A-train data for aerosol and cloud research • Implement code to handle FM-4 without SW channel • use night to constrain MODIS => CERES LW. • in day use CERES Total minus MODIS LW = CERES SW.
CERES/Aqua FM-4 SW Anomaly History History- • On March 30, 2005 at 18:42 GMT the CERES/Aqua FM-4 instrument stopped collecting valid Shortwave channel radiometric measurements. • Failure was characterized by an immediate railing ‘high’ of the SW channel data stream, which subsequently drove the SW channel bridge balance electronics into a reset condition to bring the SW channel output on-scale. • The Total and Atmospheric Window radiometric channels continued to function nominally. • All other housekeeping and science parameters remained within nominal ranges and continue to do so. No increased noise or precursor indicators prior to event. • Anomaly resolution team formed on March 31st and developed a strategy to guide the investigation. NGST is included on the team. • Despite all attempts to revive it, the SW channel remains unusable, characterized by significant ‘noise’ and a rapidly varying zero point.
Instrument Operations Satellite Direction Onset of the anomaly for the CERES FM-4 SW Channel at ~18:42 GMT 03/30/05. Plotted are the geo-located SW channel measurements. The black and red striping indicates ‘railed’ data at either 0 or 4095 counts.
CERES/Aqua FM-4 SW Anomaly Analysis and Recovery Efforts Actions- • Anomaly resolution team formed on March 31st and developed a strategy to guide the investigation. NGST is included on the team. • ~24:00 GMT March 31st, the CERES/Aqua FM-3 instrument was placed in the Cross-track scan mode to preserve the CERES Climate Data Record measurements. • Complete memory dump of the FM-4 instrument was accomplished on 4/1/05. Indicated no corruption of the flight software or memory locations, discounting SEU. • Flight Software autonomous bridge balance bias control bypassed on SW channel in favor of manual control in attempt to maintain sensor output on-scale. • Completed P-Spice modeling effort to characterize anomaly and test failure modes. • Compared SW science output to MODIS in an attempt to quantify gain changes. • Elevated, by ~2-deg C, the temperature of the Sensor Electronics Assembly board by raising the detector heatsink temperatures. • Bias voltage necessary to keep sensor output on-scale continues to trend back towards pre-anomaly values, but we see no improvement in sensor noise.
CERES/Aqua FM-4 SW Anomaly Failure Hypotheses • There has been a failure of one of the resistors in the Sensor Electronics Assembly SW channel circuitry. • Characterized by an abrupt shift in resistance followed by a fairly rapid oscillation (+- 10’s of ohms) about the nominal resistance (>100K) • P-Spice model used to test failure hypotheses, we do not have the capability to probe this circuitry via flight software to isolate the faulty resistance. • CERES does utilize Vishay resistors which have been implicated in failures on other projects. • Failure required to produce the current symptoms is different from previous Vishay failures. These demonstrated much larger increased resistances (10’s of K) with an oscillation between the nominal and increased value. • CERES Project was aware of issues with Vishay, TRW implemented additional screening procedures prior to acceptance. • The CERES bolometers are one of the resistors in this electronics circuit. • A delamination of the SW thermistor could also produce the anomalous symptoms.
CERES/Aqua FM-4 SW Anomaly Future Directions and Impacts Performance • The radiometric performance of the two remaining channels remains nominal. On-Going Work • Current plan is to complete recovery efforts by 9/1/05. • Will drop SEA temperature 2-deg C below nominal for approximately 1-week in attempt to perturb sensor output • Subsequently we will continue to monitor performance and manually attempt to maintain SW sensor output on-scale. Operational Implications • Anomaly team is confident this is a part, and NOT a design issue. • Team has not identified any operational modifications. • Little to no impact with regard to the anticipated lifetimes of other CERES instruments.
CERES/Aqua FM-4 SW Anomaly Science Impacts Near Term No impact: the CERES/Aqua FM-3 instrument is collecting global cross-track data. 2 years of Rotating Azimuth Scan data already required for Aqua ADM development. Total and Window channels unaffected. Process without SW channel in near-term. Long Term If anomaly cannot be resolved, longer term science issues include (in order of priority) • significantly increased risk of a gap from Terra/Aqua climate record to the beginning of • NPOESS using FM-5 in 2011/2012 (from 7% to 12% risk: exceeds 10% goal). Assess CERES Total minus MODIS LW = broadband SW to minimize impact. • the second Aqua CERES instrument for the A-train was to scan along-track for multi- • angle views over the lidar/radar track to examine effects like 3-D radiative transfer. Assess CERES total minus MODIS LW = broadband SW to minimize impact. • the second Aqua CERES instrument is also used to perform intercalibrations with GERB: • but these can be accomplished by the second Terra CERES as long as two CERES • instruments are active on Terra • the second Aqua CERES instrument is also used during cloud/aerosol field experiments • to provide multi-angle data that tracks a pre-selected surface site (e.g. ARM site).
CERES vs ERBE Cloud Forcing 3 to 5 Wm-2 differences doubling CO2 ~ 3 Wm-2 Only CAM2 climate model yet agrees with CERES even on global mean cloud forcing: seasonal and zonal errors are much larger Climate Models vs CERES Cloud Forcing (DJF 60N-60S) Zhang et al., 2005
DJF Zonal Mean Cloud All Models show poor dependence on latitude and cloud height: larger than differences of CERES-MODIS vs ISCCP Climate Models vs CERES-MODIS and ISCCP Cloud Data Zhang et al., 2005
DJF Zonal Mean Cloud All Models show poor dependence on latitude and optical depth: larger than differences of CERES-MODIS vs ISCCP Climate Models vs CERES-MODIS and ISCCP Cloud Data Zhang et al., 2005
JJA - DJF Seasonal Changes: All Models show better performance for seasonal changes in cloud type than for mean properties, but still very large errors vs climate change goals when compared to CERES-MODIS vs ISCCP Climate Models vs CERES-MODIS and ISCCP Cloud Data Zhang et al., 2005
DJF Cloud Types by Height / Optical Depth Class Large climate model errors by cloud type Climate Models vs CERES-MODIS and ISCCP Cloud Data (DJF, 60S - 60N) Zhang et al., 2005
CERES/Aqua FM-4 SW Anomaly Onset March 30, 2005
We should regularly evaluate gap risk for all satellite variables.... For U.S. CERES-like fluxes: Terra, Aqua, NPOESS in 2012 (black line in plot. )
CERES Science Team: Bruce A. Wielicki, Principal Investigator Phase II: 2004-2007 Adds university, NCAR, GSFC researchers. 30 science team members
Terra/Flight Model 1Lifetime Radiometric StabilityDetermined with the Internal Calibration Module Absolute Calibration: 0.5% LW 1% SW 1% Window Stability Goal: better than 0.5% per 5 years Normalized to Ground Calibration Data
Jan/Feb 98 El Nino TOA LW Flux Anomalies TRMM CERES Satellite Observations NOAA GFDL Older Climate Model (AMIP observed SSTs) NOAA GFDL Newer Climate Model (AMIP observed SSTs)
Tropical (20S - 20N) TOA Radiation Anomalies:Observations vs. Climate Models Edition 3 ERBS with altitude & day/night corrections. Net radiation increase in the 90s vs late 80s Dominated by SW Wong et al., submitted
Stainforth et al., 2005, Nature
Amount of change for a factor of 6 in climate model sensitivity, by climate variable: clouds dominate • Results from Murphy el al., Nature, Aug 04 • 58 different climate models • Range of climate sens. is factor of 5 • 31climate metrics (plot) • Bars are 25 to 75th pctile • Height of line is min to max • Non-dimensional scaling is to interannual variability (noise)- “Signal to noise” • Clouds/radiation dominate
How accurate must measurements be to constrain equilibrium global cloud feedback? Global SW Flux Change/ Decade (Wm-2) Change in Climate Sensitivity Caused by Cloud Feedback (1 = no change) • Regional changes will be larger: but no constraints on magnitude. • UKMO ensemble climate noise annual tropical mean SW and LW fluxes ~ 0.3 Wm-2
GEWEX Radiative Flux AssessmentTOA and Surface Decadal Radiation Consistency and UncertaintyCommunity Web site at the NASA Langley Atmospheric Sciences Data CenterPreliminary Report late 2005, final 2006
uses CERES data only BDS ES-8 ES-4/9 Aerosol Snow/Ice SSF (GEOS-4) CRS CERES is a Sensor Web: up to 11 instruments on 7 spacecraft all integrated to obtain climate accuracy in top to bottom fluxes AVG/ZAVG 3-hourly 1-degree grid
CERES ERBE 100 km global 0.1 micron aerosol 50 km column 100 km global 100m - 1km cloud cell Range of Cloud/Aerosol/Radiation Model Tests
New CERES ADMs greatly improve instantaneous fluxes Key to constraining more accurate surface fluxes Key to accurate cloud fluxes by cloud type Key to accurate matched satellite/surface fluxes for aerosol absorption CERES TOA instantaneous shortwave fluxes differ from ERBE by +/- 50 Wm-2 with a strong dependence on scene type & viewing angle
Use CERES Rotating Scanner hemispheric scans over two years to verify climate accuracy (large ensemble biases in new angular models: direct hemispheric radiance integration over 2 years provides truth. Factor of 2 to 10 improvement relative to ERBE. Edition 2 (ED2) are Terra ADMs used in new Edition 2 CERES Data Products ED1 used TRMM ADMs and theory for snow/ice surfaces ED2 uses Terra ADMs and Terra observed snow/ice ADMs
Differences of new CERES SW fluxes from ERBE-Like zonal means for March 2000. Differences up to 8 Wm-2. Will impact equator to pole transport, surface flux constraints with ARGO on ocean mixing processes, climate model validation New ADM Impact New Geo 3-hourly sampling impact
ARM Central Facility, Downward LW Fluxes CERES estimate (y-axis) vs ARM Surface Measurement (x-axis) All-sky, 715 CERES Overflights within 1 minute, Day and Night Overpasses, Nov 00 to Sep 01 For BSRN sites equator to pole Bias < 5 Wm-2 Instantaneous sigma 15 to 25 Wm-2 Total of 60,000 comparisons Bias < 1 Wm-2, Sigma = 15 Wm-2
Overcast Boundary Layer Cloud Systems : Observed CERES Cloud Objects for March,1998 Sample individual pdfs for just 8 of the stratus cloud systems (CERES SSF TOA albedo) Weather: can we predict why they vary? SST? wind shear? boundary layer height? Climate: can we predict the ensemble mean vs change in SST, wind shear, etc? Feedbacks in partial derivatives Xu et al., in preparation
Boundary Layer Cloud Systems: Observed CERES TOA Albedo Pdfs for March, 2000 La Nina vs March, 1998 El Nino No apparent difference in the S.E. Pacific, even though the Walker Cell strength reduced, Hadley cell strengthened... S. E. Pacific, March 2000 S. E. Pacific, March 1998 Suggests stable properties by cloud type: next step to quantify how stable.... 1 Wm-2 ? 0.1 Wm-2?
Large Deep Convective Cloud Systems: Ht > 10km, tau > 10, Fraction = 1, Diameter > 100kmMarch, 1998, 25N to 25S CERES Observations Cloud Resolving Model (2km 2-D) ECMWF initial conditions, advective tendencies Cloud Object Data available at: http://cloud-object.larc.nasa.gov/ ECMWF (50 km 3-D) Xu et al., 2005
“A-Train” Formation for Aerosol and Cloud Vertical Profiles Atmospheric State => Aerosol/Cloud => Radiative Heating
What are the Next Steps? • Take advantage of the new observations and climate model approaches: • New ~ 1km Cloud Resolving Models inside climate models: MMF • New scaled earth (DARE) models with clouds to 100’s m • New Perturbed Physics Ensembles: 1000s of Earth Like Planets • Merging Aerosol transport models with cloud resolving models • As Terra record length increases toward a decade, its power for climate studies increases dramatically: • Ocean heat storage • Cloud feedback • Aerosol Indirect Effect and Direct Effect • Polar climate change • As Terra, GERB, Aqua and A-train observations are combined: • Improved cloud and radiation diurnal cycles • Full multi-layer vertical cloud and aerosol profiling • Multi-scale modeling/observation attacks on aerosol/cloud/radiationthe “holy grails” of current climate forcing and future sensitivity
How do we determine climate prediction uncertainty?IPCC is just climate model differencesHow do we set climate observing system requirements & priorities?Global mean constraints aren’t enough
How do we relate model errors versus observations to climate prediction uncertainty? • PPE Planet “I” vs Planet “J” is a simulation of Climate Model vs Earth • Each Planet is a different Earth-like physical climate system • Planets have physics which differ in processes we don’t understand • Can we use these Planet’s past climate differences to predict differences in their future climate? • This is in fact the same as asking if we can use past climate differences in Earth vs Climate Model to predict uncertainty in predicting the future climate of Earth. • If this is not successful: we cannot predict uncertainty in predicting the real Earth: until after the fact.
Neural Net Structure Input Variables Planet “I” - Planet “J” base state CO2 climate TOA SW Flux TOA LW Flux Total Cloud Fraction Conv. Cloud Fraction Total Precipitation Large Scale Snowfall Large Scale Rainfall Surface Latent Ht Flux Surface Net SW Flux Surface Net LW Flux Surface Net Radiation Neural Network Output Variables Planet “I” - Planet “J” 2xCO2 minus 1xCO2 Surface Temperature Summer U.S. Precip Sea Leveletc...
Neural Net Prediction of Climate Sensitivity Planet “I” minus Planet “J” Doubled CO2 Global Temp Change 95% confidence bound of +/- 0.8C 33 climate model variables Neural Net Prediction: Doubled CO2 Global Temp Change (uses Planet I and J normal CO2 climate only) Y. Hu, B. Wielicki, M. Allen
Linear Regression Prediction of Climate Sensitivity Planet “I” minus Planet “J” Doubled CO2 Global Temp Change 95% confidence bound of +/- 0.8C 95% confidence bound of +/- 2.0C 33 climate model variables Neural Net Prediction: Doubled CO2 Global Temp Change (uses Planet I and J normal CO2 climate only!) Y. Hu, B. Wielicki, M. Allen