Download
1 / 27

E N D
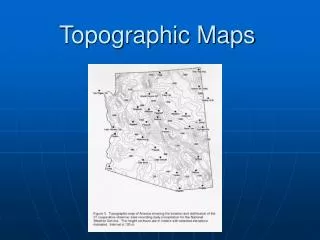
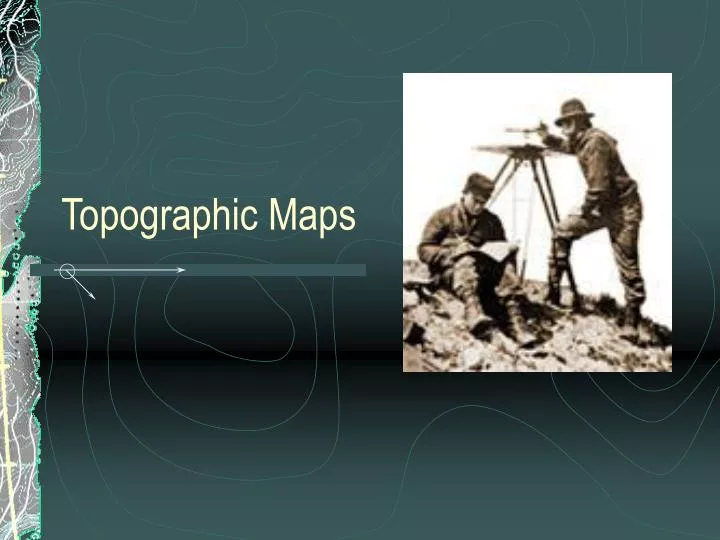
What is a Topographic Map? A map is a representation of the Earth, or part of it. The distinctive characteristic of a topographic map is that the shape of the Earth's surface is shown by contour lines. Contours are imaginary lines that join points of equal elevation on the surface of the land above or below a reference surface, such as mean sea level. Contours make it possible to measure the height of mountains, depths of the ocean bottom, and steepness of slopes.
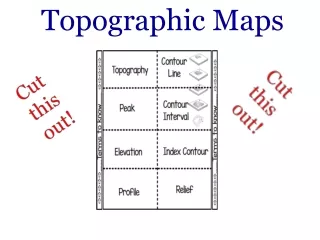
Index Contours • Generally, every fifth contour is printed darker. These lines are called index contours.
contour interval (CI) • The vertical spacing (difference in elevation) between contour lines is known as the contour interval. Typical contour intervals are 10, 20, 50, and 100 feet. The contour interval is generally given in the legend of the map.
Benchmarks (BM) • Points on the map marked "BM" are bench marks - survey points of known elevation. The exact elevation of a point is given as "BM 60" (for an elevation 60 feet above sea level).
Tips for understanding contour lines. • There are a few rules that topographic contours must obey, however, and once you understand these rules the map becomes an extremely useful and easy to use tool.
1) Every point on a contour line represents the exact same elevation • As a result of this every contour line must eventually close on itself to form an irregular circle • Contour lines on the edge of a map do not appear to close on themselves because they run into the edge of the map, but if you got the adjacent map you would find that, eventually, the contour will close on itself.
2) Contour lines can never cross one another. • Each line represents a separate elevation, and you can’t have two different elevations at the same point. The only exception to this rule is if you have an overhanging cliff or cave
3) Moving from one contour line to another always indicates a change in elevation. To determine if it is a positive (uphill) or negative (downhill) change you must look at the index contours on either side (see figure).
4)On a hill with a consistent slope, there are always four intermediate contours for every index contour. • If there are more than four index contours it means that there has been a change of slope and one or more contour line has been duplicated. This is most common when going over the top of a hill or across a valley (see figure).
5) The closer contour lines are to one another, the steeper the slope is in the real world. The farther apart, the more gentle.
7) Contour lines crossing a stream valley will form a "V" shape pointing in the uphill (and upstream) direction.
Now you draw the lines • Imagine you have gone out and taken the elevation of several points • Now you want to add the contour lines • Determine the contour interval and what lines you need to draw • Extrapolate where the lines would be • This means thinking of an imaginary number line • Decide which contour line would fit between two points http://terraserver-usa.com/image.aspx?T=1&S=11&Z=14&X=1701&Y=10309&W=1&qs=300+Viking+Blvd%7cWinfield%7c%7c&Addr=300+N+Viking+Blvd%2c+Winfield%2c+KS+67156&ALon=-96.9692407&ALat=37.2437477
Topographic profile • Gives you a side view
Topographic Profile • Lay a strip of paper across the map • Draw a line at the start and stop of the map • Draw a tic where a contour line touches the paper • Mark the elevation on the paper
Beginning with your starting elevation, go directly above the tic mark on your paper and make a small dot on the graph paper at the corresponding elevation
Draw a smooth line to connect the dots on the profile • This is what the land would look like if you were sailing up to it on a boat
Find the • Hill • Steep slope • Cliff • Closed contour • Stream v-upstream • Index contours • Contour interval