Download
1 / 13
130 likes | 328 Views
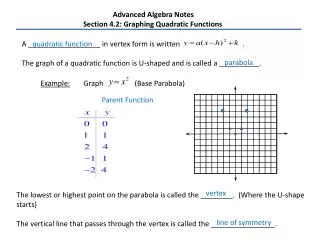
Lesson 10.1: Graphing Quadratic Functions pg. 524. Objectives : To graph quadratic functions. To find the equations of the axis of symmetry and the coordinates of the vertex of a parabola. Vocabulary. Quadratic function : an equation of the form y = ax ² + bx + c , where a ≠ 0 .

E N D
Lesson 10.1:Graphing Quadratic Functionspg. 524 Objectives: To graph quadratic functions. To find the equations of the axis of symmetry and the coordinates of the vertex of a parabola.
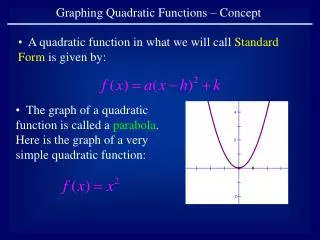
Vocabulary • Quadratic function: an equation of the form y = ax² + bx + c, where a ≠ 0. • Parabola: the graph of a quadratic function. y x
Minimum: the lowest point on the graph of a curve. • Maximum: the highest point on the graph of a curve. Vertex: themaximumand minimum point of a parabola minimum maximum
Symmetry: a geometric property of figures that can be folded and each half matches the other exactly. y Axis of symmetry: the vertical line containing the vertex of the parabola. x
Equation of the Axis of Symmetry of a Parabola The equation of the axis of symmetry for the graph of y = ax² + bx + c, where a ≠ 0, is Once the axis of symmetry is found choose values for x above and below that value to help find y. Use this formula to find the x-coordinate of the vertex.
Special Note: When graphing a quadratic function….. -If the leading coefficient a is POSITIVE the graph will OPEN UP. y = ax² + bx + c -If the leading coefficient a is NEGATIVE the graph will OPEN DOWN. y = -ax² + bx + c
Ex. 1: Graphing Quadratic Functions using a table of values. • y = 3x² - 6x – 2 a) Equation for axis of symmetry. b) Vertex c) Max or Min
y 10 x -10 -10 10 2. y = -5x² + 10x + 4 a) Equation for axis of symmetry. b) Vertex c) Max or Min
y 10 x -10 -10 10 3. y = -2x² - 8x - 2 a) Equation for axis of symmetry. b) Vertex c) Max or Min
y 10 x -10 -10 10 4. y = x² - 4x + 3 a) Equation for axis of symmetry. b) Vertex c) Max or Min
5. y = x² - 5 a) Equation for axis of symmetry. b) Vertex c) Max or Min
6. y = -2x² a) Equation for axis of symmetry. b) Vertex c) Max or Min
Summary In a quadratic function y = ax² + bx + c, if…. a > 0, graph opens up (“a” is positive) a < 0, graph open down (“a” is negative) ---> Use to find the x-coordinate of the vertex and put one x value above and below that point. Then graph using a table of values. NBA #7, page 528, problems 10-28 even