Download
1 / 9
110 likes | 505 Views
Profit is $50. Profit = (Price – Average Total Cost) x Quantity = (20 – 15) x 10. 2 . Lightly shade and label the area of deadweight loss. 3 . Lightly shade and label the area consumer surplus. 4 . Indicate the socially optimum price and quantity on the graph. Consumer Surplus.

E N D
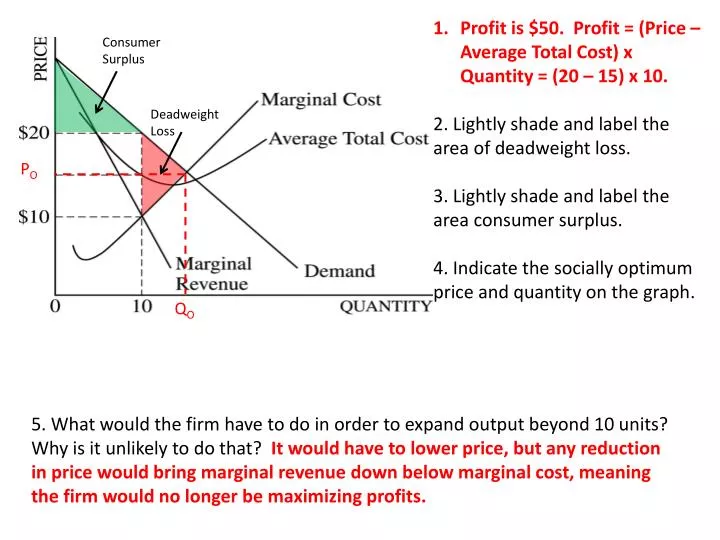
Profit is $50. Profit = (Price – Average Total Cost) x Quantity = (20 – 15) x 10. 2. Lightly shade and label the area of deadweight loss. 3. Lightly shade and label the area consumer surplus. 4. Indicate the socially optimum price and quantity on the graph. Consumer Surplus Deadweight Loss PO QO 5. What would the firm have to do in order to expand output beyond 10 units? Why is it unlikely to do that? It would have to lower price, but any reduction in price would bring marginal revenue down below marginal cost, meaning the firm would no longer be maximizing profits.
6. Of the two market structures we have studied (perfect competition and monopoly), which one is represented by the graph at left? How can you tell? It’s a monopoly because it has a downward-sloping demand curve and marginal revenue < price. 7. On the graph, draw in the profit-maximizing quantity and price for the firm. See graph. 8. Is this firm experiencing positive economic profit, normal profit, or negative economic profit? Shade in the area of economic profit (or loss) and explain. Economic loss. Price is less than ATC. 9. What should this firm due in the short-run (trick question)? What should it do in the long-run? Short –run: you can’t tell because there is no AVC curve. Long-run: It should shut down if it can’t lower its costs so that ATC is less than price. Liam F., notice what we were talking about yesterday. When I draw the graph correctly, with MC intersecting ATC at its minimum point, the graph doesn’t make it look like the company could produce where price = ATC.
10. Why is the demand curve for a monopolist downward-sloping? Because the monopolist is the entire industry, his demand curve is the same as the industry demand curve. In order to sell more output, the monopolist must lower price. 11. Why does the marginal revenue curve for a monopolist lie below the demand curve? In other words, why is marginal revenue always less than price for the single-price (non-price-discriminating) monopolist? Because the monopolist must reduce price on all units in order to sell additional output. This means that his total revenue will not increase by the full amount of the price when output is increased. Example: 10 units sold at $100 = $1000 in total revenue. 11 units sold at $99 = $1089 in total revenue. The price of the 11th unit is $99, but The marginal revenue of the 11th unit is only $89.
12. Assume now that this monopolist’s variable costs decrease. Indicate this change in costs on the graph. Draw in the new profit-maximizing quantity and price after the decrease in costs. Is the firm now making positive, normal, or negative economic profit? Explain Note: this will depend on where you drew your new curves (how much you shifted them.) In my example, the firm is still incurring losses, because price is still below ATC at the profit-maximizing quantity.
13. If the monopolist in the graph at left were producing at quantity Q2, what would be happening to total revenue with each additional unit sold? Explain. Total revenue would decrease with each additional unit because marginal revenue at that point (and beyond) is negative. 14. What level of output and price from the graph above would achieve allocative efficiency? Explain. Q2 and P3. That is where marginal cost = price, which is equal to the marginal benefit society places on the good. 15. In the graph above, what will be the firm’s total revenue at profit-maximizing price and level of output? What will be the firm’s profit? Total revenue = P4 x Q1. Profit = (P4 - P2) x Q1
16. In the graph at left, what area represents consumer surplus at profit-maximizing quantity and price (identify by letters). HJP5 17. If the firm at left were to produce at the allocatively efficient level of output, what would happen to consumer surplus (be specific – if it would change, by how much would it change)? It would increase by the area JKP4P5 18. If this firm decided to maximize total revenue rather than profit, at what level of output would it produce? Explain. It would produce at Q3. Up until that point, marginal revenue is positive, so total revenue is increasing. Beyond that point, total revenue begins to decrease because marginal revenue is negative.
19. At what point does this monopolist’s demand curve become inelastic? Explain. Note: This might be a hard question for some of you. Use your book. Think. You can get this and it’s important that you are able to. The demand curve becomes inelastic at Point L. Beyond that point, total revenue decreases with any decrease in price (because marginal revenue becomes negative at that point). This is one of the definitions of “inelastic.”
20. Which area represents the economic profit of the profit-maximizing monopolist pictured at left (identify by letters). RIUL 21. If this were a perfectly competitive industry with the same costs as the one pictured at left, what would be the short-run equilibrium price and quantity? What long-term changes would occur to supply, price, and quantity in the industry as a result of this? Price = T. Quantity = Q3. New firms would enter so supply would increase, price would decrease, and quantity would increase. 22. Assume that a monopolist is charging all of its customers a single price. If it can find a way to charge each of its customers what he or she is willing to pay, what would happen to: a. Profit – Increase b. consumer surplus – Decrease c. level of output – Increase 23. What is the scenario described in #22 called? Be specific. Perfect price discrimination.
24. A prescription drug maker charges different prices for its products in different countries due to the different demand curves in each country. a. What pricing practice is this firm engaging in? Price discrimination. b. What allows this firm to do this? It is able to segregate its market and sell to different customers at different prices based on their different demand curves. c. Why would this firm be against a law that allows its prescription drugs to be re-imported into the United States from a foreign country? (For example, exported to Indonesia for sale there, and then shipped back to the United States by a retail seller.) Consider this question in the context of this chapter. This would destroy its ability to price discriminate by allowing re-sale of its product. For example, an Indonesian company could export the drug to the U.S. and sell it cheaper than prices in the U.S. market.