1 / 1

Figure 2.1. Reported number of acute hepatitis A cases — United States, 2000–2011

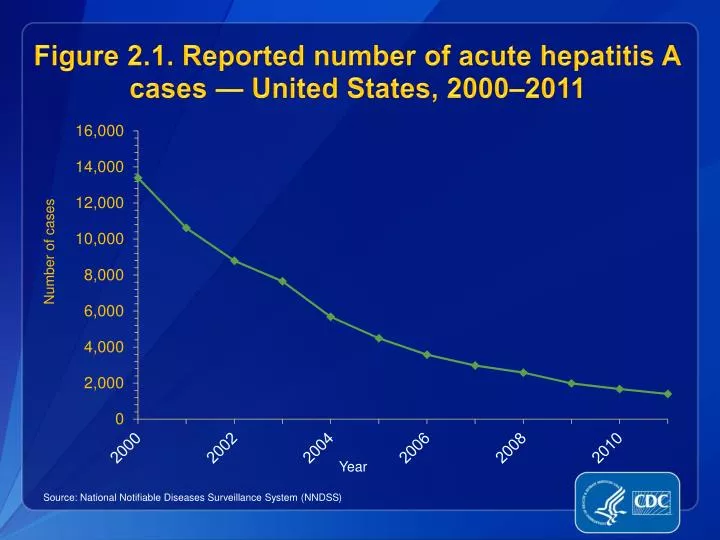
Figure 2.1. Reported number of acute hepatitis A cases — United States, 2000–2011. Source : National Notifiable Diseases Surveillance System (NNDSS ).

noelle-cote
Download Presentation

Figure 2.1. Reported number of acute hepatitis A cases — United States, 2000–2011

An Image/Link below is provided (as is) to download presentation Download Policy: Content on the Website is provided to you AS IS for your information and personal use and may not be sold / licensed / shared on other websites without getting consent from its author. Content is provided to you AS IS for your information and personal use only. Download presentation by click this link. While downloading, if for some reason you are not able to download a presentation, the publisher may have deleted the file from their server. During download, if you can't get a presentation, the file might be deleted by the publisher.

E N D

Presentation Transcript


  1. Figure 2.1. Reported number of acute hepatitis A cases — United States, 2000–2011 Source: National Notifiable Diseases Surveillance System (NNDSS)

More Related