Download
1 / 22
280 likes | 392 Views
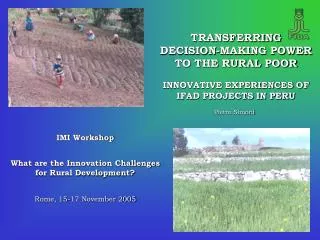
M&E: IFAD’s approach and experience in India. MoRD Workshop New Delhi 12 th August 2013. Setting the stage for M&E. Human capacities -- knowledge, skills, attitudes, relationships, resources and motivations. MIS -- data storage, processing, access, retrieval etc.

E N D
M&E: IFAD’s approach and experience in India MoRD Workshop New Delhi 12th August 2013
Setting the stage for M&E • Human capacities-- knowledge, skills, attitudes, relationships, resources and motivations. • MIS-- data storage, processing, access, retrieval etc. • Organisational structure-- where does project M&E sit organisationally, are there appropriate organisational incentives for M&E? How do M&E functions fit in organisational information flows and do they support efficient communication on project execution? • Culture- nurturing a culture of learning where processes and results of M&E are seen as valuable and integral part of normal work functions. • M&E plans- a clear plan articulating information needs, how they will be addressed, what resources are committed, who is assigned responsibilities
Elements of IFAD’s M&E • Approach: • Standardized system applicable to all IFAD projects • Aims to ensure minimum level of reporting at IFAD • Components: • RIMS • Annual Outcome Surveys • Project MIS and M&E
What is RIMS? • RIMS (Results and Impact Management System) is a comprehensive system for measuring and reporting on the results and impact of IFAD- supported country programmes. • Reporting by project to IFAD and by IFAD to its governing bodies. • Includes a menu of standard indicators used to measure and report on the performance across all IFAD projects— activities, outputs, outcomes and impact. • Project M&E includes RIMS indicators but is not limited to it.
Management Information System MIS M&E Monitoring & Evaluation RIMS IMPACT Results & Impact Management System Impact Measurement RIMS in the context of a Project The performance of RIMS will depend largely on that of the Monitoring and Evaluation Systems
RIMS Indicators and reporting First-level results: measure financial and physical progress (Component wise) Report updated regularly as a part of progress reporting; annual records submitted to IFAD by January every year. Second-level results: measure improved functionality and/or behavioural change , improved performance and sustainability of groups, institutions and infrastructure Reporting of achievements required from Mid-Term Third-level results (impact): measure combined effects of the 1st and 2nd level results, are quantitative (e.g. households reporting increased assets) . Sample of 900 HHs; combined with Anthropometry of under 5.
From Results to Impact 1st LEVEL RESULTS [OUTPUTS] 2nd LEVEL RESULTS [OUTCOMES] 3rd LEVEL RESULTS [IMPACT] Measures financial and physical progress indicators — outputs Assesses effectiveness and sustainability and/or modified behaviour — outcomes Measures combined effect of 1st and 2nd level indicators — goal RIMS Reporting Impact Surveys By Project team By external agency
Executing RIMS from project start-up to completion • Identify and agree on a list of indicators, including targets at Appraisal. • Four indicators, mandatory for all IFAD projects: • # of households with improvement in HH assets • Prevalence of child malnutrition • # of Hs that have improved food security • # of persons receiving project services • Ensure that selected RIMS indicators are part of the M&E system. • Monitor the indicators and report to IFAD annually: reviewed during supervision missions and included as SVR appendix. • Conduct Baseline assessment at start-up and impact assessment at completion.
HEALTH FOOD CARE NUTRITION STATUS + Women’s Empowerment (female literacy) (community development) + Food Availability (increased production, more diversified diet) + Access to Food (higher incomes) + Environmental Health (safe drinking water) + Access to Services (higher incomes) Why malnutrition?
Measure of malnutrition • Chronic malnutrition/ stunting (height for age): most relevant indicator of the overall well-being (or poverty) in community. • Acute malnutrition/ wasting (weight for height): usually associated with temporary shocks. • Underweight status (weight for age): used to monitor the status of individual children, such as in growth promotion activities Anthropometry of children under the age of 5
Survey Software • All standard RIMS analyses embedded in software; • Reports produced in tables and graphs; • Child malnutrition measured against new WHO standards; • PCA calculations and relative wealth reports conducted; • All reports and all data can be exported to different formats; • Follow up surveys can be compared • Manual available online
Annual Outcome Survey What it is • It is a simple household survey undertaken annually by the project staff. It covers a small sample of 200 households selected randomly. • A comparison group of 200 household selected randomly. • Covers issues like income, hunger periods, agri production etc. Why is it needed • Measures more regularly positive /negative changes/outcomes taking place at the household level • Provides early evidence of project failure or success so that corrective actions may be taken if required • Assesses targeting efficiency.
Examples of data gathered from outcome surveys • Based on 2010 AOS, 24% HHs in the Jharkhand Tribal Development Programme reported an increase in crop productivity, of which 85% attributed the increase to project activities. • In OTELP, about 55% of households surveyed experienced increased productivity, which may be the result of adopting technologies promoted by the project, which 65% of households did.
Reports • Annual COSOP Review • Country Programme Issues Sheets • Annual RIMS Reports • Annual Outcome Survey Reports • Baseline and End-line Reports
Results- for the overall India portfolio • COSOP Strategic Objective No. 1-Increased access to agricultural technologies, natural resources. • 101,620 persons trained in crops and livestock; • 2474 persons accessing technical advisory services • COSOP Strategic Objective No. 2-Increased access to financial services and value chains. • 1.2 million active savers; • 920,248 active borrowers; • INR 2.7 billion savings; • 1.3 million active SHG members • Others • Approx 1.5 million households (7.5 million persons) have received direct project services under the country programme in on-going projects. • Approx. 1.3 million women are current members of project self-help groups in the India country programme.
Lessons/ Challenges • What gets reported gets monitored • Developing a culture for Quality • Use of data/ information for planning • Timely conduct of baseline- procurement related issues • Alignment with national/ state systems
Sample of RIMS indicators • People in savings and credit groups formed/strengthened • People receiving vocational training • People trained in business/entrepreneurship • People trained in crop production practices and technologies • People trained in financial services • People trained in fish production practices and technologies • People trained in income generating activities • People trained in infrastructure management • People trained in livestock production practices and technologies • People trained in NRM • People trained in post-production, processing and marketing • Processing facilities constructed/rehabilitated • Rainwater harvesting systems constructed/rehabilitated • Roads constructed/rehabilitated