Download
1 / 22
220 likes | 327 Views
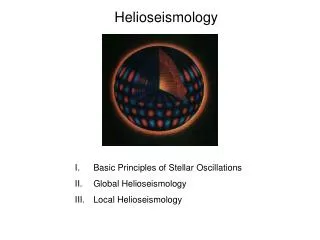
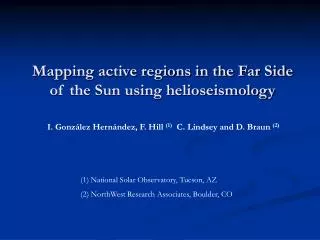
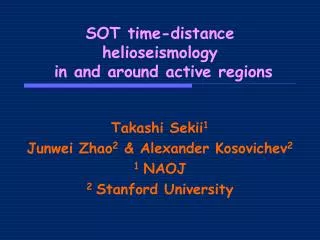
Far-Side Imaging from Time-Distance Helioseismology. Junwei Zhao W. W. Hansen Experimental Physics Laboratory, Stanford University, Stanford, CA94305-4085. 2006 Sheffield Workshop.

E N D
Far-Side Imaging from Time-Distance Helioseismology Junwei Zhao W. W. Hansen Experimental Physics Laboratory, Stanford University, Stanford, CA94305-4085
Irene and I took a same train from Sheffield to London, without knowing exactly when we would fly out from London due to a terrorists’ event targeting Heathrow airport. We had a useful discussion on the train, and she encouraged me to develop a time-distance far-side imaging method, which would not just to confirm holography results, but also complement those results.
In the Following 3 months … It turned out that the far-side imaging analysis was way easier than I had thought. From scratch to seeing the first far-side active region, it only took me about 3 weeks. The method was based double-double acoustic skips. Then I further developed the analysis codes for single-triple and double-triple measurement schemes. In about 3 months, I got all the materials for this paper. It was a very productive 3-month period.
Far-Side Acoustic Signals (a) Acoustic power spectrum using MDI medium-l data; (b) time-distance diagram obtained from 24-hr MDI data; (c) time-distance diagram obtained using only signals inside the white box in (a).
Measurement Schemes Panel (a) shows the measurement scheme using a 2 by 2 skips on either side of the target region; panel (b) shows the measurement scheme using a 1 by 3 skips on either side; and panel (c) shows the scheme using a 2 by 3 skips on either side.
Far-Side Images of AR10486 and AR10488 First row shows the travel-time maps measured using 4-skip schemes, and the second row shows the travel-time maps measured using 5-skip schemes. The third row shows a combination of both sets of measurements. The fourth row highlights the results by saturating the measurements.
Three-Skip Measurement Scheme First row shows travel-time deficits measured using 3-skip scheme. Note that the ray paths are not able to fully cover the complete far side, leaving a big hole near the center. Second row shows results from a combination of 4- and 5-skip measurements. Third row shows results combining all 3-, 4-, and 5-skip measurements. A combination seems to only improve the final results moderately.
Then Enters HMI … It has long been agreed, among the few who were involved in the far-side imaging, that both holography and time-distance far-side images be put side by side online, so as to give more confidence to the users of these data. I felt very bad that my long-time promise was not realized even when HMI was over 4 years old. It was particularly sad to think about that Irene was not able to see how the HMI time-distance far-side images look like. I spent nearly the whole last month, building up the HMI time-distance far-side imaging pipeline.
Data Reduction • One essential thing is how to reduce HMI resolution to fit the far-side imaging calculation. I first remapping the 4096×4096 data to 1024×1024 in Postel’s coordinate. Then this data is Gaussian convolved to 200×200 data. • I tried different approaches, and found that the final far-side images did not change significantly. Probably, the hmi.vw_V_45s may be the most time efficient data without loss of much accuracy.
4-skip 5-skip 4- and 5-skip
4-skip 5-skip 4- and 5-skip
4-kip 5-skip 4- and 5-skip
To increase the reliability of the far-side active region images, Charlie used 5 days’ average data to increase the signal-to-noise ratio. This is a brilliant approach, making the far-side regions more consistent from day to day.
Center-to-Limb Travel-Time Variation Different from holography technique, the time-distance analysis does not show substantial center-to-limb variations. The variation seen in our analysis is typically less than 5 sec, and typically smaller using MDI data than using HMI data.
Time-distance far-side images provide a useful complement to the existing holography far-side images. To summarize, for the time-distance far-side images, about40°-wide area near the west limb often has strong spurious features [this phenomenon was not seen in MDI data analysis], while other areas (the central part and the part near the east limb) provide consistent and sometimes better results than holography. A combination of both sets of images will greatly enhance the forecast capability. And now, finally, I followed my promise to Irene and a few others.