Download
1 / 5

E N D
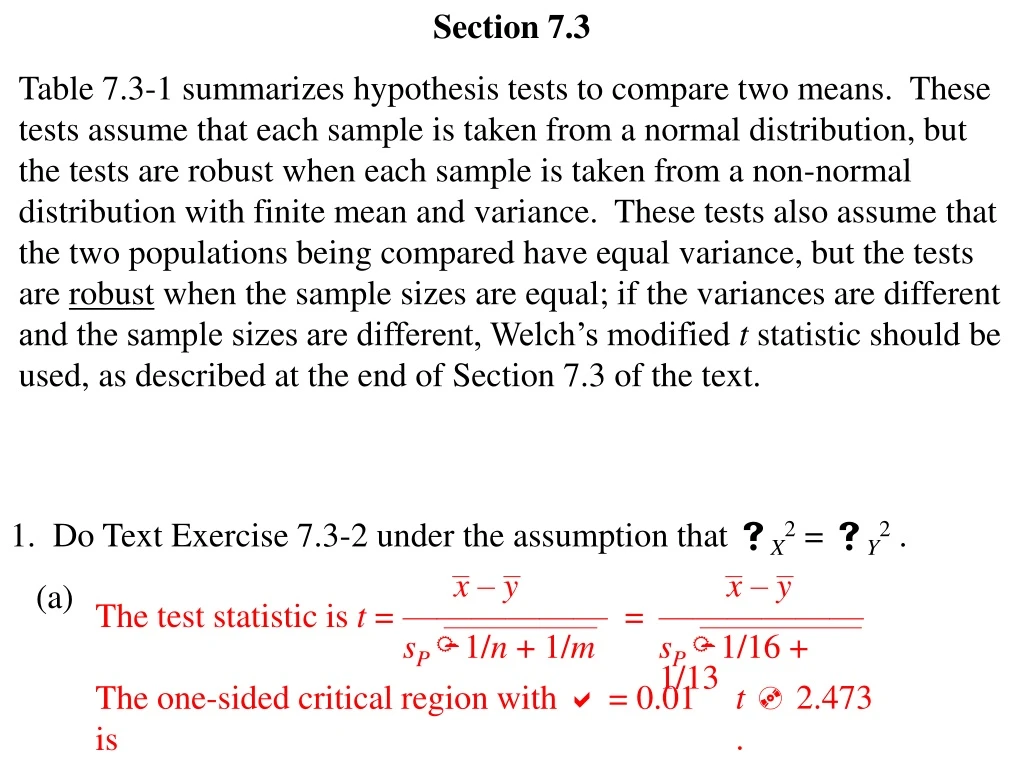
Section 7.3 Table 7.3-1 summarizes hypothesis tests to compare two means. These tests assume that each sample is taken from a normal distribution, but the tests are robust when each sample is taken from a non-normal distribution with finite mean and variance. These tests also assume that the two populations being compared have equal variance, but the tests are robust when the sample sizes are equal; if the variances are different and the sample sizes are different, Welch’s modified t statistic should be used, as described at the end of Section 7.3 of the text. 1. Do Text Exercise 7.3-2 under the assumption that X2 = Y2 . (a) x– y —————— = sP1/n + 1/m x– y —————— sP1/16 + 1/13 The test statistic is t = The one-sided critical region with = 0.01 is t 2.473 .
(b) (c) (15)(1356.75) + (12)(692.21) s2P = ———————————— = , t= 27 1061.40 5.570 Since t = 5.570 > t0.01(27) = 2.473, we reject H0. We conclude that the males have higher mean weight. a t(27) random variable The p-value of the test is P(T 5.570) which is considerably less than 0.005, from Table VI in Appendix B. The results of Welch’s test are almost identical. We find that the test statistic is t = 5.767, the degrees of freedom 26.6 27, and the critical region is still defined by t2.473.
2. (a) (b) Use the Analyze > Compare Means > Independent-Samples T Test options in SPSS to do Text Exercise 7.3-5 under the assumption of equal variances. x– y —————— = sP1/n + 1/m x– y —————— sP1/14 + 1/14 The test statistic is t = The one-sided critical region with = 0.05 is t– 1.706 .
From the SPSS output, we find t = – 1.714 . Since t = – 1.714 < – t0.05(26) = – 1.706, we reject H0. We conclude that the mean birth weight is smaller with mothers who have five or fewer prenatal visits. a t(26) random variable (c) The p-value of the test is P(T– 1.714) which is between 0.025 and 0.05, from Table VI in Appendix B. From the SPSS output we find p-value = 0.098 / 2 = 0.049.
2.-continued (d) The box plots appear to support the conclusion.