Download
1 / 20
200 likes | 283 Views
Transient IP Structures Associated with Short-Scale Variations in the SEP and GCR Flux. T. Mulligan, B. Blake The Aerospace Corporation H. Spence, and A. Jordan Boston University D. Shaul and J. Quenby Imperial College Acknowledgement to R. Mewaldt for providing STEREO B LET data.

E N D
Transient IP Structures Associated with Short-Scale Variations in the SEP and GCR Flux T. Mulligan, B. Blake The Aerospace Corporation H. Spence, and A. Jordan Boston University D. Shaul and J. Quenby Imperial College Acknowledgement to R. Mewaldt for providing STEREO B LET data
Introduction • Brief description of Polar HIST sensor • Switch to a high-statistics (HS) science mode on HIST motivated by coherent variations in GCR frequently observed at Polar, Wind, ACE, and INTEGRAL s/c during heliospheric current sheet (HCS) crossings and Interplanetary CME transits and need to better understand energy response of HIST to high-energy protons • Active Sun in December 2006 gave multiple SEP events to cross-calibrate high-statistics mode • Observation of electron precursor to Dec 13th SEP and GLE • Unusual SEP signatures observed inside ICME on Dec 15 • in solar wind at ACE, Wind, and STEREO • in polar cap (PC) at Polar HIST • Different signature at GEO raises questions
Polar High Sensitivity Telescope HIST HIST contains a ~3.5 x 5 cm plastic scintillator (large omni-directional geometric factor for penetrating particles) Designed for relativistic electron radiation-belt studies Large omni-directional geometric factor is well suited for studying short-period variations In December 2006 GLE event the count rate exceeded 105 during a six-second rotation of Polar
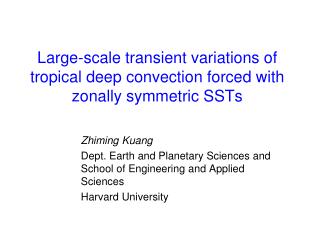
GCR Modulation on 06-15-99 seen by HIST HIST scintillator data shows short-period GCR beginning shortly before 14:00 UT Observation lasts approximately 5 hours Polar passing through polar cap (PC) region MTM and MEM analyses show strong coherence at 1.5 mHz HIST count rates in normal science mode are too low to perform rigorous analysis
GCR Modulation on 06-15-99 seen by Wind Wind Epact data also shows short-period GCR variability on similar time-scales Observation lasts throughout the day Wind is located in upstream solar wind near L1 at this time MTM, MEM analyses indicate coherence at similar and slightly lower frequencies than HIST data, strongest coherence at < 1mHz. Again, low GCR count rates make analysis difficult
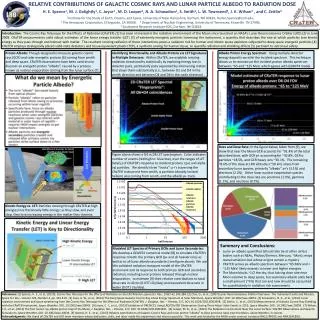
ACE Solar Wind Observations 06-15-99 Shock, low field strength and variance prior to GCR variability onset HCS sector boundary crossing with sharp change in field strength and variance Numerical particle tracing of GeV protons IP fields show oscillation in downstream local magnetic mirror (green) Oscillation is along radial direction at multiple frequencies over large fraction of AU
Polar HIST in High-Statistics (HS) Mode HIST HS mode has 256 digitized bins (0-255) Bins 0-254 range from comfortably above noise up to ~10 MeV All pulses >10 MeV appear in the “overflow” bin 255 (magenta trace). As expected, most counts are in overflow bin December 2006 SEP event data shown are divided into four sums of 64 bins plus the overflow bin 255
Opportunity in SEP Events of Dec 2006 Dec 13, 2006 SEP observed at ACE, Wind, STEREO B, GOES, and Polar Satellites in magnetosphere see similar signatures as s/c in solar wind Polar is in southern polar cap during declining phase of SEP Long SEP decay time allows intercalibration of HS mode Ensuing days bring IP shock and ICME with rise in energetic particles and an additional SEP on Dec 15
100 MeV proton gyroradius 100 MeV proton gyroradius 40 MeV proton gyroradius 40 MeV proton gyroradius Y Wind X ACE STEREO Z Wind ACE Y STEREO Spacecraft Orbit Geometries Movie of orbit tracks for the spacecraft during the interval from 12/13 to 12/16 (same interval as the time series plot) Top panel is GSE ecliptic plane; bottom panel is plane of sky as viewed from Sun Top(bottom) tick marks every 20(15)Re; grid lines every 40(30)Re Wind and ACE are on opposite sides of the Earth-Sun line and above the neutral sheet; Wind is ~250 Re sunward. GOES 10 is at dusk, GOES 11 at dawn, and GOES 12 is at subsolar region during the short-scale particle variation Gyroradii of 40 MeV proton (8 Re) and 100 MeV proton (16 Re) shown for leading edge ICME field ACE and Wind separated azimuthally by 6x-12x proton gyroradii in energies of interest
Observations of the Electron Precursor to 12/13 Ground Level Event HEO4 shows electron precursor >300 keV arrives ~13 minutes earlier than the GeV protons causing the GLE, shown here by Polar HIST and the Oulu Neutron Monitor These electron precursors can be over 60 minutes in advance of solar protons (Posner et al 2006) Important fact is that the precursor electrons do NOT have a higher velocity than relativistic protons
Polar HIST HS Mode Response SEP on 12/13 provides unique opportunity for cross-calibration of Polar HIST with GOES Decay of event was exponential with large number of protons >100 MeV Using 0600 UT –1200 UT on Dec 13 as calibration interval Interval was chosen to maximize the decay data and minimize the influence of the radiation belts. The data was truncated 1 hr prior to radiation belt passage HS mode digitized bins 0-254 range from threshold of noise up to10 MeV These data are divided into 4 sums of 64 (bin sums [0, 63] and [64,127] are shown) All pulses larger than 10 MeV appear in overflow bin 255 e-fold time of HIST is 3.65 hrs similar to GOES 100 MeV channel with e-fold time of 3.37 hrs
ICME Shock Particles on 12/14 Polar and STEREO HS mode high count rates at 6-second intervals complements STEREO high resolution solar wind flux measurements Top panel shows December events at Polar and STEREO Bottom panel shows fine structure observed at HIST near the IP shock on 12/14 GOES 100 MeV channel does not have the counting statistics to resolve the fine structure of the shock observed at Polar and STEREO shock
SEP Within an ICME on 12/15 IP shock on Dec 14th driven by ICME (between solid lines) Classic particle decrease in ICME magnetosheath same at all s/c Just inside ICME leading edge SEP is observed, caused by a solar flare near center disk Polar is exiting southern PC after shock passage and beginning of SEP on 12/15 ACE, Wind, STEREO, and Polar observe short-scale modulation of particle signature within the ICME GOES 10 &11 integral fluxes do not show this signature at GEO (GOES 12 data unavailable)
Satellite Orbit Geometries Movie of orbit tracks during 12/14 1400 UT to 12/15 0600 UT (from the IP shock through the 1st half of the ICME) Top panel is GSE ecliptic plane; bottom panel is plane of sky as viewed from Sun (tick marks 1 Re apart; grid lines 2 Re apart) GOES 12 (red)leadsGOES 11 (yellow) by ~4 hrs MLT ; GOES 10 lags GOES 11 by same amount (not shown) GOES 10 is pre-noon, GOES 11 is post-noon region, and GOES 12 is near dusk when leading edge of ICME hits Earth; Polar (green) in southern auroral oval during this time The short-scale particle variation inside the ICME exists at Polar so why not at GOES 10 and GOES 11?
Summary & Conclusions Large geometric factor of Polar HIST plastic scintillator is well suited for obtaining high count rate statistics at high energies and high cadences needed to reliably measure shot-scale SEP and GCR variability Cross-calibration of HIST HS mode during long decay of SEP on 12/13/06 shows overflow bin 255 on HIST has similar e-fold time as GOES 100 MeV integral flux channel SEP and GCR observations show short-scale energetic particle modulation occurs when in Earth is downstream of shocks, near HCS boundaries and ICMEs Best observation periods are when Polar is on open field lines either crossing through the PC or in the auroral oval Electron precursor to December 13th SEP observed ~13 minutes prior to ground level event at Oulu Neutron Monitor, requires more study Unusual SEP signatures observed inside ICME on 12/15 evident at ACE, Wind, and STEREO in solar wind and at Polar HIST, but signature observed at GEO orbits remains ambiguous Need to exercise some caution using GEO data in IPM models Did Comet McNaught play a role?
Radiation Belt Passes Polar HIST in High-Statistics (HS) Mode In HS mode all pulses >10 MeV appear in the “overflow” bin 255 Bin 255 has similar energy response as GOES >100 MeV channel Direct comparison of GOES > 100 MeV and HIST bin 255 clearly shows lack of variability at GOES Variation at HIST seen during other passes currently under study
GOES Differential Proton Fluxes Differential proton flux data shown at ~1 MeV to 80 MeV energies for GOES 10, 11, and 12, respectively. GOES 10 and 11 show little if any short-scale modulation GOES 12 15-40 MeV energy band shows clear short-scale modulation Flare region on 12/15 is near center of solar disk Better connectivity expected at dawn due to nominal Parker spiral field direction, but this is not observed– is this an ICME connectivity issue?
GOES Integrated Proton Fluxes Top panel shows differential proton flux at GOES 12 integrated over 2 energy bands Similar short-scale particle variation as seen at Polar and in the solar wind observed in 15-80 MeV energy band at GOES 12 (located near dusk) IP shock passage marked by vertical lines Bottom two panels compare the 15-80 MeV energy band at GOES 12 with GOES 10 and GOES 11, respectively Again, GOES 10 (pre-noon) or GOES 11 (post-noon) do not show this feature