Download
1 / 1
10 likes | 85 Views
Nomenclature of MS/MS Fragmentation Ions. Mass Spectrometry Data. Summary.

E N D
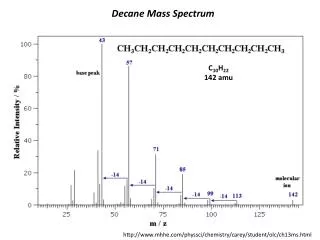
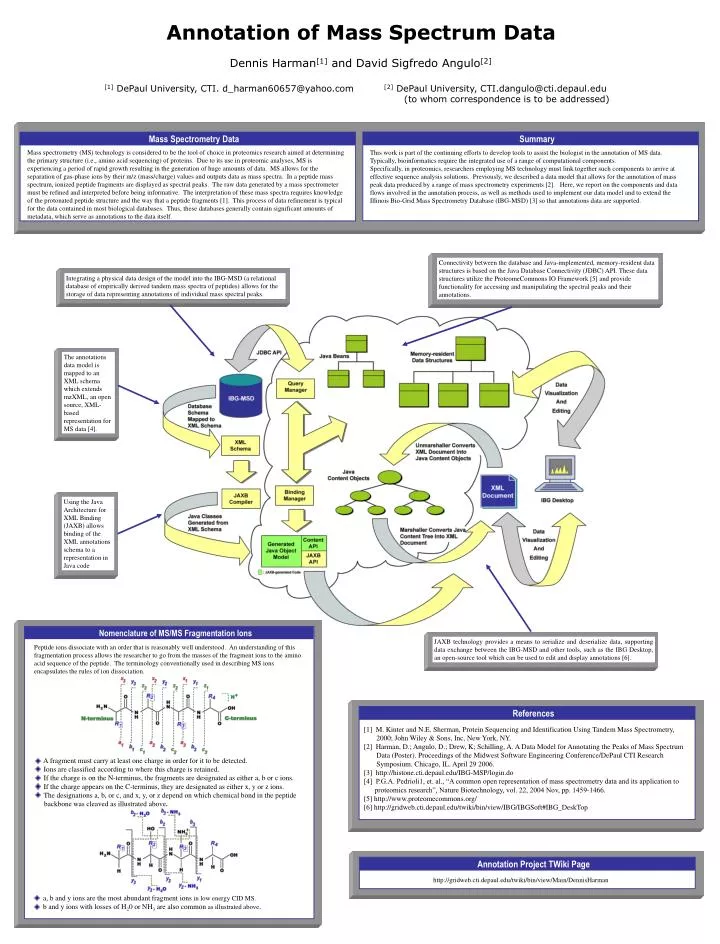
Nomenclature of MS/MS Fragmentation Ions Mass Spectrometry Data Summary Mass spectrometry (MS) technology is considered to be the tool of choice in proteomics research aimed at determining the primary structure (i.e., amino acid sequencing) of proteins. Due to its use in proteomic analyses, MS is experiencing a period of rapid growth resulting in the generation of huge amounts of data. MS allows for the separation of gas-phase ions by their m/z (mass/charge) values and outputs data as mass spectra. In a peptide mass spectrum, ionized peptide fragments are displayed as spectral peaks. The raw data generated by a mass spectrometer must be refined and interpreted before being informative. The interpretation of these mass spectra requires knowledge of the protonated peptide structure and the way that a peptide fragments [1]. This process of data refinement is typical for the data contained in most biological databases. Thus, these databases generally contain significant amounts of metadata, which serve as annotations to the data itself. This work is part of the continuing efforts to develop tools to assist the biologist in the annotation of MS data. Typically, bioinformatics require the integrated use of a range of computational components. Specifically, in proteomics, researchers employing MS technology must link together such components to arrive at effective sequence analysis solutions. Previously, we described a data model that allows for the annotation of mass peak data produced by a range of mass spectrometry experiments [2]. Here, we report on the components and data flows involved in the annotation process, as well as methods used to implement our data model and to extend the Illinois Bio-Grid Mass Spectrometry Database (IBG-MSD) [3] so that annotations data are supported. The annotations data model is mapped to an XML schema which extends mzXML, an open source, XML-based representation for MS data [4]. Connectivity between the database and Java-implemented, memory-resident data structures is based on the Java Database Connectivity (JDBC) API. These data structures utilize the ProteomeCommons IO Framework [5] and provide functionality for accessing and manipulating the spectral peaks and their annotations. Using the Java Architecture for XML Binding (JAXB) allows binding of the XML annotations schema to a representation in Java code Integrating a physical data design of the model into the IBG-MSD (a relational database of empirically derived tandem mass spectra of peptides) allows for the storage of data representing annotations of individual mass spectral peaks. JAXB technology provides a means to serialize and deserialize data, supporting data exchange between the IBG-MSD and other tools, such as the IBG Desktop, an open-source tool which can beused to edit and display annotations [6]. http://gridweb.cti.depaul.edu/twiki/bin/view/Main/DennisHarman References Annotation Project TWiki Page [1] M. Kinter and N.E. Sherman, Protein Sequencing and Identification Using Tandem Mass Spectrometry, 2000; John Wiley & Sons, Inc, New York, NY. [2] Harman, D.; Angulo, D.; Drew, K; Schilling, A. A Data Model for Annotating the Peaks of Mass Spectrum Data (Poster). Proceedings of the Midwest Software Engineering Conference/DePaul CTI Research Symposium. Chicago, IL. April 29 2006. [3] http://histone.cti.depaul.edu/IBG-MSP/login.do [4] P.G.A. Pedrioli1, et. al., “A common open representation of mass spectrometry data and its application to proteomics research”, Nature Biotechnology, vol. 22, 2004 Nov, pp. 1459-1466. [5] http://www.proteomecommons.org/ [6] http://gridweb.cti.depaul.edu/twiki/bin/view/IBG/IBGSoft#IBG_DeskTop Annotation of Mass Spectrum Data Dennis Harman[1] and David Sigfredo Angulo[2] [1] DePaul University, CTI. d_harman60657@yahoo.com [2] DePaul University, CTI.dangulo@cti.depaul.edu (to whom correspondence is to be addressed) Peptide ions dissociate with an order that is reasonably well understood. An understanding of this fragmentation process allows the researcher to go from the masses of the fragment ions to the amino acid sequence of the peptide. The terminology conventionally used in describing MS ions encapsulates the rules of ion dissociation. A fragment must carry at least one charge in order for it to be detected. Ions are classified according to where this charge is retained. If the charge is on the N-terminus, the fragments are designated as either a, b or c ions. If the charge appears on the C-terminus, they are designated as either x, y or z ions. The designations a, b, or c, and x, y, or z depend on which chemical bond in the peptide backbone was cleaved as illustrated above. • a, b and y ions are the most abundant fragment ions in low energy CID MS. • b and y ions with losses of H20 or NH3 are also common as illustrated above.