Download
1 / 47
470 likes | 583 Views
Development Strategy Analysis with MAMS: Structure and Policy Insights. Hans Lofgren Carolina Diaz-Bonilla World Bank South Africa National Treasury Symposium Economy-wide Analysis and Economic Policy May 28, 2009. Introduction.

E N D
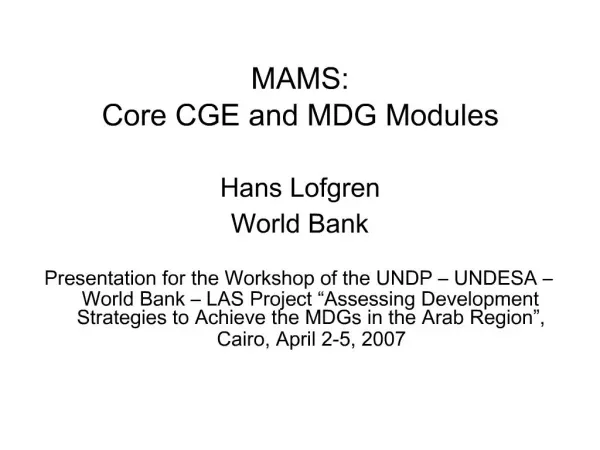
Development Strategy Analysis with MAMS: Structure and Policy Insights Hans Lofgren Carolina Diaz-Bonilla World Bank South Africa National Treasury SymposiumEconomy-wide Analysis and Economic PolicyMay 28, 2009
Introduction • MAMS (Maquette for MDG Simulations); a dynamic-recursive CGE (Computable General Equilibrium) Model. • Initially developed for country-level MDG strategies: How should government and aid policies be designed to achieve the MDGs? • Evolved into a general framework for country-level, ex-ante, medium-to-long-run development policy analysis, with emphasis on fiscal issues and MDG indicators. • Different versions ranging from aggregated macro version to disaggregated MDG version. • In addition to major non-monetary MDGs, MAMS covers monetary poverty, like other CGE models using two alternative approaches: representative household (RH) and microsimulation (MS).
Introduction • As of May 2009, applications in 35 countries (18 in Latin America and the Caribbean; 8 in Sub-Saharan Africa; 5 in MENA; 4 in other Asia) • Used for World Bank country analysis (including Country Economic Memoranda, Public Expenditure Reviews, Poverty Assessments), by teams in developing countries (in joint work with the UN). • For info on MAMS and the work program around MAMS, visit: www.worldbank.org/mams
Outline • Issues in MDG strategy analysis • Model structure • Examples of scenarios • Poverty analysis with MAMS • Dominican Republic: A MAMS-microsimulation application • Policy insights from country studies • Summary/Conclusions
1. Issues in MDG strategy analysis • MAMS is designed to consider the following aspects of MDG scenarios: • Role of non-government service providers • Demand-side conditions (incentives, infrastructure, incomes) • Role of economic growth • Macro consequences of increased government spending under different financing scenarios • Diminishing marginal returns (in terms of MDG indicators) to services and other determinants • Role of efficiency and input prices (e.g. wages) in determining unit service costs
2. Model Structure • MAMS may be described as an extended, dynamic-recursive computable general equilibrium (CGE) model designed for MDG analysis. • MAMS is coded in GAMS/Excel. • MAMS is complementary to and synthesizes resuls from sector and econometric research on MDGs. • Motivation behind the design of MAMS: • An economywide, flexible-price model is required. • Standard CGE models provide a good starting point. • But standard CGE approach must be complemented by a satisfactory representation of 'social sectors'.
2. Model Structure Features Common to Most CGE Models • Computable solvable numerically • General economy-wide • Equilibrium • agents have found optimal solutions subject to constraints • quantities demanded = quantities supplied • macroeconomic account balance • Producers use factors and intermediates as inputs. • Imperfect transformability/substitutability in foreign trade. • Dynamic-recursive the solution in any time period depends on current and past periods, not the future. • A “real” model: only relative prices matter; no modeling of inflation.
2. Model Structure Figure. Aggregate payments in MAMS Factor Domestic Private Savings Markets Factor Wages Costs & Rents Gov. Savings Taxes Intermediate Input Cost Households Government Sav./Inv. Activities Transfers Private Government Consumption Investment Com’ty Consumption Demand Markets Domestic Sales Foreign Transfers Imports Exports Foreign Savings Rest of the World
2. Model Structure Government • Government services are produced using labor, capital, and intermediates. • Government spending is split into • Recurrent: consumption, transfers, interest • Capital (investment) • Government demand (consumption and investment) is classified by function: social services (education, health, water-sanitation), infrastructure and “other government”. • Government spending is financed by taxes, domestic borrowing, foreign borrowing, and foreign grants. • Model tracks government domestic and foreign debt stocks (including foreign debt relief) and related interest payments.
2. Model Structure MDGs • Most MAMS applications cover MDGs 1 (poverty), 2 (primary school completion), 4 (under-five mortality rate), 5 (maternal mortality rate), 7a (water access), and 7b (sanitation access). • The main originality and extensions of MAMS compared to standard CGE models is the inclusion of (MDG- and/or education-related) social services and their impact on MDGs and other aspects of social and economic performance. • Social services may be produced by the government and the private sector.
2. Model Structure MDG “production” • Each MDG “produced” by a combination of determinants (including government social services; see table) using a (reduced) functional form that permits: • Imposition of limit (maximum or minimum) • Replication of base-year values and elasticities • Calibration to additional point (typically conditions at which the MDG in question is achieved). • Diminishing marginal returns to the inputs • Two-level function: • Constant-elasticity function at the bottom: Z = f(X) • Logistic function at the top: MDG = g(Z); (see graph)
2. Model Structure Determinants of MDG outcomes
2. Model Structure Logistic function
2. Model Structure Education and labor • Service measured per student in each teaching cycle (primary, secondary, tertiary). • Model tracks evolution of enrollment in each cycle • Educational outcomes as functions of a set of determinants: for each cycle, rates of entry, pass, repeat, and drop out; between cycles, share that continues • MDG 2 (net primary completion rate) computed as product of 1st grade entry rate and primary cycle pass rates for the relevant series of years. • Shares of students exiting the school system join the labor force in the segment that corresponds to their educational achievement.
2. Model Structure Dynamics • Updating of stocks of • factors (endogenous for different types of labor and capital, exogenous for other factors); and • population (with some age disaggregation; exogenous in most applications) • debt (domestic and foreign; both endogenous) • TFP (Total Factor Productivity) • Endogenous part is a function of (i) economic openness; (ii) government infrastructure capital stocks. • Exogenous part captures what is not explained in model (institutions, new technologies, ….) • GDP growth is determined by: • growth in economywide TFP (influenced by labor-force composition) • growth in factor employment (mostly endogenous)
2. Model Structure Flexible modeling framework • MAMS has a flexible disaggregation of production activities and commodities, factors, and households (GAMS facilitates) • Data readily available for virtually any country for the MAMS minimum version: simple two-sector (government – private) framework for dynamic macro analysis. • MAMS may include: • Wide range of taxes • NGO + private MDG/HD services • Special-case sectors (resource-based export, regulated utility) • Special versions developed to deal with additional issues: demography, gender, and natural disasters.
2. Model Structure Policy tools and indicators • Key policy tools under government control: • level and composition of government spending (by function); • financing of government spending (taxes, domestic or foreign borrowing, foreign grants) • Key performance indicators include the evolution of: • Private and government consumption and investment, exports, imports, value-added, taxes; all indicators may be national totals or disaggregated • Domestic and foreign debt stocks • MDG indicators (poverty, non-poverty MDGs) • Educational composition of labor force
2. Model Structure Macro Closures • Mechanisms for clearing (assuring that receipts = outlays) of: • Balance of Payments – real exchange rate • Savings-Investment Balance – private investment • Government budget → next slide
2. Model Structure Government Closures • The selection of variable clearing the government budget is an important part of many scenarios. Common options: • Domestic tax rates • Domestic borrowing • Foreign grants • Foreign borrowing • Scaling of government spending item(s)
2. Model Structure Market-clearing variables for commodities and factors • Commodities. Three categories: • Domestic output sold at home: prices • Exports: quantities demanded (or international demand function) • Imports: quantities supplied • Factors. Two alternatives: • exogenous unemployment: wage clears • endogenous unemployment. Two regimes: • unemployment above minimum rate: unemployment rate clears (influencing reservation and market wage) • unemployment at minimum rate (= full employment): wage clears
2. Model Structure Factor market with endogenous unemployment
2. Model Structure Steps in Simulation Analysis • Run base (business-as-usual) scenario: • Purpose: a plausible benchmark for comparisons • GDP growth calibrated to trend from last 5-15 years; • Balanced and sustainable evolution of macro aggregates (private and government consumption and investment; foreign and domestic debt stocks; tax revenues from different taxes; foreign grant aid …); many of these items may have unchanged GDP shares. • Run alternative (counter-factual) scenarios. For example: • Change one or more parameters (policy tools or parameters beyond government control, e.g. aid, world prices, productivity) • Fix the evolution of a policy target (ex: a health MDG); flex a policy tool (ex: government health services). • Analyze and validate: • explain results for individual scenarios and across scenarios; • validation is issue-specific • if needed, adjust data, model, or simulation design.
3. Examples of Scenarios • Questions commonly addressed by non-BASE scenarios: What happens if the government … • expands services sufficiently to reach the MDGs with additional financing provided by (a) foreign grants; (b) domestic taxes; (c) domestic borrowing? • contracts in one area (e.g. human development or other government) and expands in another (e.g. infrastructure) with unchanged aid and domestic policies? • in one or more areas, expands services sufficiently to make use of additional financing from a, b, or c (see 1)? • becomes more/less productive, adjusting one or more types of spending or financing in response?
4. Poverty Analysis with MAMS • Two basic approaches to poverty and inequality analysis using MAMS and other CGE models: • representative household (RH) • microsimulation (MS) • Both generate standard poverty and inequality indicators.
5. Dominican Republic: A MAMS-Microsimulation Application • Context: Input into the National Development Strategy of the DR. • The MDG version of MAMS was applied to a 2007 DR database. • MS used for poverty-inequality analysis.
MDG Key Indicators 6. Dominican Republic: A MAMS-Microsimulation Application Note: Nearest available year if data not available for 1990 or 2004. Value for Poverty (MDG 1) based on year 1998. Determinants of non-poverty MDGs: (1) Service delivery; (2) Per-capita household consumption; (3) Public Infrastructure; (4) Wage incentives; and (5) Other MDGs.
Simulations and Results Simulations • BASE - Baseline Scenario • TAX - MDG scenario with domestic taxes closing the government budget • FB - MDG scenario with foreign borrowing closing the government budget • TRDOFF - Trade-off scenarios between HD and Infrastructure spending
7. DR: Simulations and Results Baseline assumptions • Simulations run for 2007-2015. • 5% GDP growth – close to trend 1970-2005 • Government consumption growth: • Overall growth near 4.2% • Primary education: growth sufficient to gradually raise services per student by 35% by 2015.
7. DR: Simulations and Results MDG scenario assumptions • Simultaneous achievement of all model MDGs by 2015. • MDGs targeted via endogenous variations in government demand (consumption) of relevant services. • Alternative sources of financing of the required increase in government expenditure: • Domestic taxes • Foreign borrowing.
7. DR: Simulations and Results Table 1. Simulation Results
Accelerated government consumption and investment growth. Health most expensive for DR; grows steadily, becoming more expensive in second half. Education requires a lot of up-front spending; need to reach 2008 target. 7. DR: Simulations and Results MDG Results
7. DR: Simulations and Results Government Expenditure on Primary Education (DR$ bn)Baseline and MDG Simulations
7. DR: Simulations and Results Government Expenditure on Health (DR$ bn)Baseline and MDG Simulations
7. DR: Simulations and Results Table 2. Poverty and Inequality Results
7. DR: Simulations and Results Trade-off scenario assumptions • Exogenous variation of investment in government infrastructure capital. • Endogenous adjustment in HD (health, education, water-sanitation) spending to respect fiscal space limits. • Factors influencing the results: • Growth in HD services has a positive impact on HD MDGs. • Growth in infrastructure capital stocks raises TFP, GDP and private consumption and investment. • The marginal returns from infrastructure capital stocks are diminishing • Slower growth in more educated labor reduces GDP growth.
7. DR: Simulations and Results Figure 3. Poverty-HD Trade-off
7. DR: Simulations and Results Results In spite of considerable progress across the board, the DR cannot achieve its MDGs under current policies and investment levels. Very difficult to achieve all MDGs, especially in health and education. DR government allocates relatively small share of GDP to social sectors as compared to other countries in LAC. Effect of large expansion in government services very much depends on the financing mechanism.
7. DR: Simulations and Results Results (cont.) If marginal financing needs met by foreign borrowing, then no trade-off between poverty reduction and growth promotion versus achievement of non-poverty MDGs. However, DR unlikely to further raise its foreign debt and debt-servicing burden. Rapid growth is crucial for achievement of the MDGs.
6. Policy insights from country studies • Human development (HD) vs. infrastructure: • Additional infrastructure spending has a more positive short-to medium-run growth impact while also having positive HD effects. • Balanced scenarios (expanding both infrastructure and HD) are more attractive in terms of outcomes (extreme scenarios face diminishing marginal returns) and politics.
Insights (cont.) • Income distribution: • A major short- to medium-run effect of scaled-up HD spending is higher wages of the more educated throughout the economy (also in the private sector), putting sectors that are intensive in educated labor at a cost disadvantage. • In the long run, this relative-wage switch may be reversed as scaled up education spending raises the supply of educated labor.
Insights (cont.) • Domestic financing vs. foreign aid. • Reliance on domestic sources to finance additional spending involves difficult short- to medium-run trade-offs between the poverty MDG and other MDGs. • Reliance on aid for marginal financing makes trade-offs easier.
Insights (cont.) • Foreign aid and Dutch disease (DD). • The strength of DD effects depends on the marginal import share of government spending. • DD effects are stronger for HD-focused scenarios in so far as additional spending is on non-tradables. • Slower export growth and faster import growth (common effects of more aid) are “disease” symptoms if the aid makes a needed future export/import growth reversal more difficult.
Insights (cont.) • Government efficiency. • Feasible reallocations over time from areas with small or no returns can lead to noticeable improvements in performance. • What is feasible is highly country-specific.
Insights (cont.) • Be cautious! • Issues are complex, model structure and parameter values are uncertain analysts should present the simulation results with humility, viewing them as aids to thinking that should be cross-checked against insights based on other methods and intuition.
7. Summary/Conclusions • MAMS: a tool for analyzing the impact of alternative scenarios on economic development, including monetary poverty and other MDGs. • DR simulation analysis illustrates the application of MAMS to the analysis of alternative MDG scenarios and trade-offs between HD and infrastructure spending.
8. Summary/Conclusions Summary/Conclusions • The Road Ahead: • better specifications of dynamic household behavior (savings/investment, demography, migration), markets (segmentation, space, transactions costs) • careful issue/country-specific applications of existing tools
Key References • Bourguignon, Francois, Carolina Diaz-Bonilla, and Hans Lofgren. 2008. “Aid, service delivery and the Millennium Development Goals in an Economywide Framework,” pp. 283-315 in François Bourguignon, Maurizio Bussolo, and Luiz A. Pereira da Silva, eds. The Impact of Macroeconomic Policies on Poverty and Income Distribution: Macro-Micro Evaluation Techniques and Tools. Washington, D.C.: World Bank. Also issued as World Bank Policy Research Working Paper 4683. • For more, see: www.worldbank.org/mams