Download
1 / 17
170 likes | 324 Views
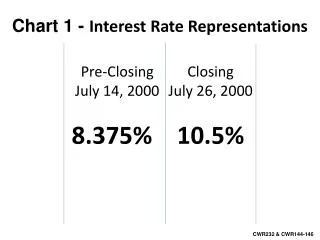
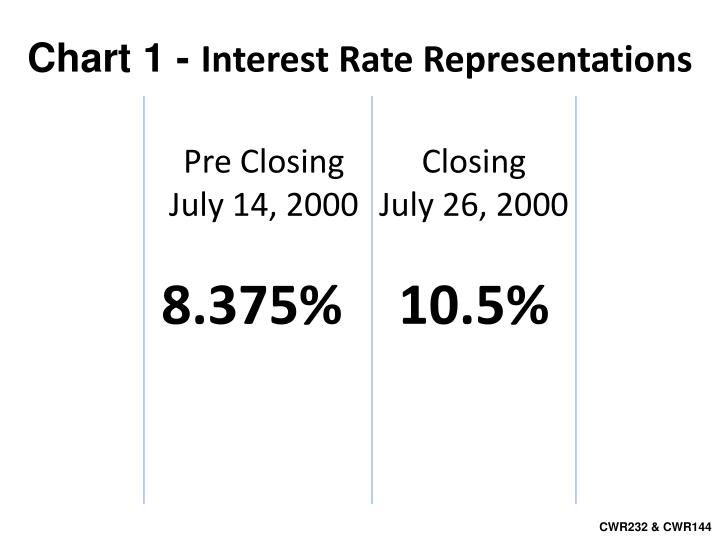
Chart 1 - Interest Rate Representations. Closing July 26, 2000. Pre Closing July 14, 2000. 10.5%. 8.375%. CWR232 & CWR144. Chart 2 -Truth in Lending Representations. Pre Closing July 14, 2000. Closing July 26, 2000. Post-Closing Jan. 14 , 2004. 12.899%. 14.350%. 15.11%.

E N D
Chart 1 - Interest Rate Representations ClosingJuly 26, 2000 Pre ClosingJuly 14, 2000 10.5% 8.375% CWR232 & CWR144
Chart 2 -Truth in Lending Representations Pre ClosingJuly 14, 2000 ClosingJuly 26, 2000 Post-ClosingJan.14, 2004 • 12.899% 14.350% 15.11% CWR121 & CWR231
Chart 3 - Monthly Payment Pre ClosingJuly 14, 2000 ClosingJuly 26, 2000 Post-Closing2000-2004 • $353.43 $472.01 $526.90 CWR231, CWR232, CWR121 & 9a Exhibit Payment/Escrow Detail - 3134022
Chart 4 - Interest Rate Comparison “Good Faith Estimate” vs. “Actual” “Teaser Rate” “Bait and Switch” “Approximately Double 8% to16% • Note: Actual = Includes fees, force placed insurance (home and flood) and misc… • “Bait and Switch” - almost doubled the interest rate (difference of 7.336%)
Chart 5 - Finance Charge Comparison “Good Faith Estimate” vs. “Truth in Lending Disclosure Statement” “Teaser Rate” “Bait and Switch” Nearly, $100,000 difference in total Finance Charge “Bait and Switch” – difference in cash finance charge over the life of the loan Faith to TILDS $83,986.67 & Faith to Actual $173,108.61-$79,996= $93,112.61”
Chart 6 - Monthly Payment “Good Faith Estimate” vs. “Truth in Lending Statement” • “8.375% , 14.350% and 15.711% • “Bait and Switch” - Monthly charge Difference of Good Faith to TILDS $173.47 • and Good Faith to Actual $353.43- $609.00= $255.57”
Chart 7 – 29Payment History July 14, 2000 January 2004 $526.90 $353.42 $10,249.47 $24,593.78 CWR232 CWR144
Chart 8 – Payment History (29) Principal payments made Note: no pre-payment penaltyJan 2004 “Prepaid Note in Full” $54,684.31 Total • 51,573.00 Payoff • $3,111.31 Over-Payment $42,124.96 • Feb. 14, 2005 $6,282.97 • Reversal of fees, force placed insurance • (home and flood) and misc… $6,282.97 “Note: 29 payment 00-04 =Total $24,593.78 added to 54,684.31= $79,278.09
Chart 9 - Dates range 7/14/00 to 12/5/03 Total Misc., Fees & Insurance Chart 2a Total of Interest, Insurance, Misc.and Fees $24,593.78
Option 1(insurance view) $20 per day Amount of time June 5, 2003-April 5, 2011 & over- payment (2,225 days)=$67,611.31 Interest rate 8.375% Financed for 30 years Hardship for living in a burnt home (Range of 80,000 to 150,000) Total = $183,242.00-$333,242.00 Option 2 (central view) Rent $750 per month Amount of time June 5, 2003-April 5, 2011 & over-payment (106 Months) = $82,611.31 Interest rate 10.5% Financed for 30 years Hardship for living in a burnt home (Range of 80,000 to 150,000) Total = $272,043.00-$422,043.00 Chart 10 – Present Value of Damages Due to Displacement and Loss of Use • Option 3 (punitive view) • Rent $950 per month includes utilities • Amount of time June 5, 2003-April 5, 2011 & over-payment (106 Months) = • $100,700 • Interest rate 15.711% • Financed for 30 years • Hardship for living in a burnt home (Range of 80,000 to 150,000) Total = $493,863.00- $643,863.00
Chart 11 - Countrywide Financial Highlights • Countrywide Home Loans accounts for 48% of Countrywide Financial • Net Earning 2.67 Billion in 2006 • Servicing 1.5 trillion in loans • No. #2 in loan serving • Insurance Business quote, “we are taking steps to improve our penetration of the existing Countrywide customer base through the loan servicing portfolio in our Mortgage Banking segment” • No. #1 home lender in America avg. “nearly 2 billion in loans per day” • 200 billion in total assets • 38 years in business • Net Earning growth 01-06 • 2000 = $486 million • 2001 = $842 million • 2002 = $2.373 billion • 2004 = $2.198 billion • 2005 = $2.528 billion • 2006 = $2.675 billion Annual Report 2006 - 10K
Chart 13 – Countrywide Financial Businesses at a Glance Mortgage Banking • Countrywide Home Loans (CHL) • Consumer Markets Division (CMD) • Full Spectrum Leading Division (FSLD) • Wholesale Division (WLD) • Correspondent Lending Division (CLD) • Servicing • Countrywide Home Loans • Countrywide Servicing LP • Closing Services • LandSafe • Banking • Countrywide Bank (FSB) • Countrywide Warehouse Lending (CWL) • Insurance • Balboa Reinsurance • Balboa Insurance Group • Countrywide Insurance Services • Capital Markets • Countrywide Securities Corporation (CSC) • Countrywide Commercial Real Estate Finance (CRF) • Countrywide Asset Management (CAM) • Countrywide Servicing Exchange (CSE) • Global Operations • CFC International, India Services • Countrywide International Technology Holdings, Ltd.
Chart 14 - Countrywide Financial COUNTRYWIDE FINANCIAL CORPORATION AND SUBSIDIARIESCONSOLIDATED BALANCE SHEETS
Chart 15 - Countrywide Financial $14,655,871,000 in 2007
Chart 16 - Countrywide Financial COUNTRYWIDE FINANCIAL CORPORATION AND SUBSIDIARIESCONSOLIDATED STATEMENTS OF OPERATIONS $6,061,437,000 in 2007
Chart 17 - COUNTRYWIDE FINANCIAL CORPORATION AND SUBSIDIARIES 10k SEC (http://www.secinfo.com/dVut2.t21n.htm#1n92y)CONSOLIDATED STATEMENTS OF CASH FLOWS 2007 2006 2005 Cash at end of year $ 8,810,399,000 $ 1,407,000,000 $ 1,031,108,000