Download
1 / 49
490 likes | 703 Views
Regression Method. Chapter Topics. Multiple regression Autocorrelation. Regression Methods. To forecast an outcome (response variable, dependent variable) of a study based on a certain number of factors (explanatory variables, regressors).

E N D
Chapter Topics • Multiple regression • Autocorrelation
Regression Methods • To forecast an outcome (response variable, dependent variable) of a study based on a certain number of factors (explanatory variables, regressors). • The outcome has to be quantitative but the factors can either by quantitative or categorical. • Simple Regression deals with situations with one explanatory variable, whereas multiple regression tackles case with more than one regressors.
Random Sample Population Unknown Relationship J $ J $ J $ J $ J $ J $ J $ J $ J $ Simple Linear Regression • Collect data
Multiple Regression • Two or more explanatory variables • Multiple linear regression model where is the error term and ~ N(0, 2) • Multiple Linear Regression Equation • Estimated Multiple Linear Regression Equation
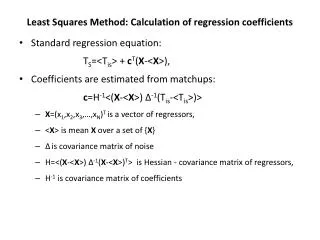
Multiple Regression • Least Squares Criterion • The formulae for the regression coefficients b0, b1, b2, . . . bp involve the use of matrix algebra. We will rely on computer software packages to perform the calculations. • bi represents an estimate of the change in Y corresponding to a one-unit change in Xi when all other independent variables are held constant.
Multiple Regression • R2=SSR/SST=1-SSE/SST • Adjusted R2 ( ) where n is the number of observations and p is the number of independent variables • The Adjusted R2 compensates for the number of independent variables in the model. It may rise or fall. • It will fall if the increase in R2 due to the inclusion of additional variables is not enough to offset the reduction in the degrees of freedom.
Test for Significance • Test for Individual Significance: t test • Hypothesis • Test statistic • Decision rule: reject the null hypothesis at α level of significance if • , or • p-value < α
Test for Significance • Testing for Overall Significance: F test • Test whether the multiple regression model as a whole is useful to explain Y, i.e., at least one X–variable in the regression model is useful to explain Y. • Hypothesis H0 : all slope coefficients are equal to zero (i.e. β1 = β2 =…= βp=0) Ha : not all slope coefficients are equal to zero
Test for Significance • Testing for Overall Significance: F test • Test statistic • Decision rule: reject null hypothesis if • F > Fα is based on an F distribution with p degrees of freedom in the numerator and n – p –1 degrees of freedom in the denominator, or • p-value < α
Example: District Sales • Use both target population and per capita discretionary income to forecast district sales.
Example: District Sales • Excel output
Example: District Sales • Multiple regression model where Y = district sales X1 = target population X2 = per capita discretionary income • Multiple Regression Equation Using the assumption E( ) = 0, we obtain
Example: District Sales • Estimated Regression Equation b0, b1, b2 are the least squares estimates of 0, 1, 2. Thus • For this example, • Predicted sales are expected to increase by 0.496 gross when the target population increases by one thousand, holding per capita discretionary income constant. • Predicted sales are expected to increase by 0.0092 gross when per capita discretionary income increase by one dollar, holding population constant.
Example: District Sales • t Test for Significance of Individual Parameters • Hypothesis • Decision rule For = .05 and d.f. = 15 – 2 – 1 = 12, t.025 = 2.179 Reject H0 if |t| > 2.179 • Test statistic • Conclusions Reject H0: 1 = 0 Reject H0: 2 = 0
Example: District Sales • To test whether sales are related to population and per capita discretionary income • Hypothesis H0 : β1 = β2 =0 Ha : not both β1 and β2 equal to zero • Decision Rule For = .05 and d.f. = 2, 12: F.05 = 3.89 Reject H0 if F > 3.89. • Test statistic F = MSR/MSE = 26922/4.74 = 5679.47 • Conclusion Reject H0, sales are related to population and per capita discretionary income.
Example: District Sales • R2 = 99.89% means that 99.89% of total variation of sales can be explained by its linear relation with population and per capita discretionary income. • Ra2 = 99.88%. Both R2 and Ra2 mean the model fits the data very well.
Regression Diagnostics • Model assumptions about the error term • The error is a random variable with mean of zero, i.e., E() = 0 • The variance of , denoted by 2, is the same for all values of the independent variable(s), i.e., Var() = 2 • The values of are independent. • The error is a normally distributed random variable.
Regression Diagnostics • Residual analysis: validating model assumptions • Calculate the residuals and check the following. • Are the errors normally distributed? • Normal probability plot • Is the error variance constant? • Plot of residuals against • Are the errors uncorrelated (time series data)? • Plot of residuals against time periods • Are there observations that are inaccurately recorded or do not belong to the target population? • Double check the accuracy of outliers and influential observations.
Autocorrelation • Autocorrelation is present if the disturbance terms are correlated. Three issues need to be addressed. • How does autocorrelation arise? • How to detect autocorrelation? • Alternative estimation strategies under autocorrelation
Causes of Autocorrelation • Omitting relevant regressors Suppose the true model is But the model is mis-specified as That is, If X2t is correlated with X2,t-1, νt is also correlated with νt-1. This is particularly serious if X2t represents a lagged dependent variable.
Causes of Autocorrelation • Specification errors in the functional form Suppose the true model is But the model is mis-specified as νt would tend to be positive for X<A and X>B, and negative for A<X<B.
Causes of Autocorrelation • Measurement errors in the variables Suppose Yt = Yt* + νt where Y is the observed value, Y* is the true value and ν is the measurement error. Hence, the true model is and the observed model is Given a “common” measurement method, it is likely that measurement errors in period t and t-1 are correlated.
Causes of Autocorrelation • Pattern of business cycle Time-series data relating to business and economics often exhibit pattern of business cycle. Sluggishness during recession persists over a certain time period while prosperity in bloom continues for a certain duration of time. It is apparent that successive observations tend to be correlated.
Testing for First Order Autocorrelation • First-order autocorrelation • The error term in time period t is related to the error term in time period t–1 by the equation εt = ρεt-1 + at , whereat ~ N(0, σa2). • Use Durbin-Watson test to test the existence of first order autocorrelation
Testing for First Order Autocorrelation • Durbin-Watson test • For positive autocorrelation H0 : The error terms are not autocorrelated (ρ = 0) Ha : The error terms are positively autocorrelated (ρ> 0) • For negative autocorrelation H0 : The error terms are not autocorrelated (ρ = 0) Ha : The error terms are negatively autocorrelated (ρ< 0) • For positive or negative autocorrelation H0 : The error terms are not autocorrelated (ρ = 0) Ha : The error terms are positively or negatively autocorrelated (ρ 0) • Test statistic
Testing for First Order Autocorrelation where r is the sample autocorrelation coefficient expressed as
Testing for First Order Autocorrelation • In “large samples”, DW 2(1–r) • If the disturbances are uncorrelated, then r = 0 and DW 2 • If negative first order autocorrelation exists, then r<0 and DW > 2 • If positive first order autocorrelation exists, then r>0 and DW < 2 • Exact critical values of the Durbin-Watson test cannot be calculated. Instead, Durbin-Watson established upper (dU) and lower (dL) bounds for the critical values. They are for testing first order autocorrelation only.
Testing for First Order Autocorrelation • Test for positive autocorrelation H0 : ρ = 0 Ha : ρ> 0 • Decision rules • If DW < dL,α, we reject H0. • If DW > dU,α, we do not reject H0. • If dL,α≤ DW ≤dU,α, the test is inconclusive.
Example: Company Sales • The Blasidell Company wished to predict its sales by using industry sales as a predictor variable.
Example: Company Sales • From the scatter plot, a linear regression model is appropriate
Example: Company Sales • SAS output
Example: Company Sales • Estimated regression equation • The market research analyst was concerned with the possibility of positively correlated errors. Using the Durbin-Watson test: H0 : ρ = 0 Ha : ρ> 0
Example: Company Sales Suppose α = 0.01. For n=20 (n denotes the number of observations) and k’=1 (k’ denotes the number of independent variables), dL = 0.95 and dU=1.15. Since DW < dL, we conclude that the error terms are positively autocorrelated.
Testing for First Order Autocorrelation • Remark • In order to use the Durbin-Watson table, there must be an intercept term in the model.
Testing for First Order Autocorrelation • Test for negative autocorrelation H0 : ρ = 0 Ha : ρ< 0 • Decision rules • If 4 – DW < dL,α, we reject H0. • If 4 – DW > dU,α, we do not reject H0. • If dL,α≤ 4 – DW ≤dU,α, the test is inconclusive.
Testing for First Order Autocorrelation • Test for positive or negative autocorrelation H0 : ρ = 0 Ha : ρ 0 • Decision rules • If DW < dL,α/2or 4 – DW < dL,α/2, we reject H0. • If DW > dU,α/2and 4 – DW > dU,α/2 , we do not reject H0. • If dL,α/2≤ DW ≤dU,α/2ordL,α/2≤ 4 – DW ≤dU,α/2 , the test is inconclusive.
Testing for First Order Autocorrelation • Remarks • The validity of the Durbin-Watson test depends on the assumption that the population of all possible residuals at any time t has a normal distribution. • Positive autocorrelation is found in practice more commonly than negative autocorrelation. • First-order autocorrelation is not the only type of autocorrelation.
Solutions to Autocorrelation (1) 1. Re-examine the model. The typical causes of autocorrelation are omitted regressors or wrong functional forms. 2. Go for alternative estimation strategy. Several approaches are commonly used. The approach considered here is the two-step Cochrane-Orcutt procedure. Consider the following model with AR(1) disturbances : (1) with
Solutions to Autocorrelation (2) Since equation (1) holds true for all observation, in terms of the (t-1)th observation, we have (2) where Now, multiply (2) by r, we obtain (3) Subtracting (3) from (1), we get That is, (4) Note that the ut’s are uncorrelated. However, r is unknown and needs to be estimated.
Two-step Cochrance-Orcutt Estimate equation (1) by Least Squares method and obtain the resulting residuals et’s. Regress et = ret-1 + ut and obtain Substitute r into equation (4) and obtain OLS estimates of coefficients based on equation (4).
The following table represents the annual U.S. personal consumption expenditure (C) in billions of 1978 dollars from 1976 to 1990 inclusively :
An OLS linear trend model has been fitted to the above data, and it gives the following residuals :
To test for positive first order autocorrelation in the error and hence estimate a model for this error process, consider H0 : r = 0 Ha : r 0 • Using the Durbin-Watson test,
When k’ =1 and n=15, dl = 1.08, du = 1.36 Hence we reject H0 • By regressing et on et-1, we obtain r = 0.79 Hence the error process is Re-estimate the trend model for consumption using the two-step Cochrane-Orcutt procedure.
Using the transformed model with t=1 indicating year 1976, sequentially until t=15 representing year 1990, the transformed data are tabulated in following table.
Applying OLS to the transformed data yields or That is, are parameter estimates of the original model.
Note that 1. Because lagged values of Y and X had to be formed, we are left with n-1 observations only 2. The estimate r is obtained based on OLS estimation assuming a standard linear regression model satisfying all classical assumptions. It may not be efficient estimator of r. This leads to the iterative Cochrane-Orcutt estimator.
Chapter Summary • Simple linear regression • Multiple regression • Regression on Dummy Variables • Autocorrelation • Durbin-Watson test • Two step Cochrane Orcutt procedure