Download

1 / 30
300 likes | 305 Views
Learn about the flood management strategies employed in the Vaal and Orange River System, including safety measures for structures, minimization of damages, and maintaining dam capacity. Real-time data collection and flood warnings are crucial in protecting lives and property. Factors like weather forecasts and El Niño/La Niña patterns also play a role in flood management decisions.

E N D
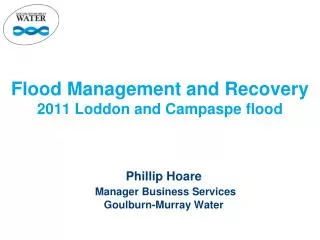
Flood Management in the Vaal- and Orange River System December 2010 - February 2011 Johan van Heerden & Brink du Plessis (Chief Eng.)D: HS Elias Nel (Sen. Scientist) W/R Planning Systems Department of Water Affairs
The “Flood Room” in Pretoria serves as an information centre to collect and distribute rainfall and flow data.Management of extreme floods in the Vaal / Orange River System is done by Directorate: Hydrological Services of the Department of Water Affairs. • The main objectives of flood management are: • Ensuring the safety of the structures (and therefore • human life) • Minimisation of damages (by minimising flow in system) • Ensuring that the dams are 100% full at the end of the flood
Vaal / Orange River System Vaal / Orange System is approximately 49% the size of South Africa Vaal- and Bloemhof Dams are equipped with spillway gates (no uncontrolled spillway)
Real time data collection points in the Upper Vaal 17 Gauging stations collect and transmit near real time flow and rainfall data to Pretoria
Real time data collection points in the Vaal / Orange River System 80 Gauging stations collecting near real time flow and / or rainfall data - available on the Hydrology real time Web Site
Routing times in Vaal / Orange System (days) Flood warnings provide time for people to take action to protect their property as well as allowing emergency services to prepare and plan for evacuations
Weather forecast El-Nino: higher probability for a dryer period in the summer rainfall area La Nina: higher probability for a wetter period in the summer rainfall area Basically all high summer rainfall events, since 1980, occurred in a La-Nina period but not all La-Nina events produced high rainfall Roughly about a 80% correlation – must be confirmed with SAWS – this is their terrain
Confluence of the Vaal- and Orange Rivers near Douglas 5 200 m3/s on 2011/01/12 Routing of 7 January 2011 at 07:00 Lower Orange River Discharge (m3/s) 2 800 m3/s Vaal River 2 400 m3/s Orange River Date (days)
Confluence of the Vaal- and Orange Rivers near Douglas Routing with all dams removed 6 300 m3/s Lower Orange River Discharge (m3/s) Vaal River Orange River Date (days)
Return periods of 2011 floods Vaal River: (first and second flood) Vaal Dam inflow 2 900 m3/s ~15 year; 1 650 m3/s <5 year (Regional Maximum flood (RMF): 14 300 m3/s) Bloemhof Dam inflow 3 600 m3/s ~20 year; 1 700 m3/s <5 year (RMF: 16 000 m3/s) Orange River: Gariep Dam inflow 2 700 m3/s ~5 year; 5 300 m3/s ~10 year (RMF: 26 600 m3/s) Vanderkloof Dam inflow 2 700 m3/s ~15 yr; 3 400 m3/s <25 year (RMF: 22 600 m3/s) Orange at Upington 5 100 m3/s ~20 year; 5 100 m3/s ~20 year
Flood management: Bloemhof Dam (inflow, outflow and capacity)
GENERAL COMMENTS When to start making use of the flood absorption capacity of the dam (Vaal Dam 26%)? (The volume of the 2011 flood at Vaal Dam was larger than the volume of the dam and at Bloemhof Dam larger than four times the volume of the dam) Weather forecasts: Short, medium and long term weather forecasts, satellite and radar images and 24-hour rainfall figures play a major role in operating decisions during the flood Thank you