Download
1 / 39
390 likes | 662 Views
Indiana’s Alternative Education Profile Project. Accountability for Confirming Success. OBJECTIVES. PARTICIPANTS WILL: Learn about Indiana’s alternative education program Learn about Indiana’s profile project Learn about Indiana’s developing accountability system for alternative education

E N D
Indiana’s Alternative Education Profile Project Accountability for Confirming Success
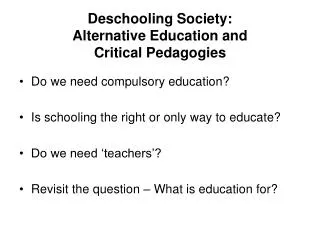
OBJECTIVES • PARTICIPANTS WILL: • Learn about Indiana’s alternative education program • Learn about Indiana’s profile project • Learn about Indiana’s developing accountability system for alternative education • Learn strategies that could be used in Oregon
IC 20-30-8 • Alternative Education Program must: • Be an educational program for eligible students that instructs them in a different manner than in the manner of instruction in a traditional school setting. • Implement Individual Service Plans (ISPs) • Operate the minimum session time of two consecutive hours
Student Eligibility (IC 20-30-8) • Grades 6-12 • Must fit into one of five categories: • Withdrawn or intending to withdraw • Failing academically • Required employment • Pregnant or parenting • Disruptive student
Student Eligibility Demographics School Year 2006-2007 • Withdrawn/intending to withdraw: 7.8% • Failing academically: 48.4% • Required employment: 1.8% • Pregnant or parenting: 4.6% • Disruptive student: 37.4%
Indiana Department of Education Policy • No greater than 15:1 teacher/student ratio • Programs should embrace best practices for alternative education • Programs should generally be the child’s primary educational placement
Indiana’s Goals for Alternative Education • Increase the percentage of alternative education programs meeting program goals. • Increase the percentage of 12th grade students in alternative education programs who graduate. • Increase the percentage of students served by alternative education programs who achieve positive outcomes. • Decrease the number of dropouts in school districts with alternative education programs. • Decrease the number of expulsions in school districts with alternative education programs.
SY 2006-07* Number of Programs 229 Number of Students Served 28,078 Number of Counties Represented 66 (72%) Number of Participating Districts 191 (58%) *SY07-08 data not yet available
Types of Programs • 8% (19) Short-term placement that keeps students involved in education. • 33% (76) To bring academically failing students back to grade level. • 21% (48) To deal with students with behavioral/discipline issues. • 38% (86) To prepare students for life after school as productive citizens.
06-07 Alternative Education Demographics Poverty Free Lunch: 49% Reduced Lunch: 9% Paid Lunch: 42% Special Education Special Ed: 19% General Ed: 81% Grade Grade 6: 4% Grade 7: 11% Grade 8: 14% Grade 9: 19% Grade 10: 17% Grade 11: 16% Grade 12: 19% Gender Male: 57% Female: 43%
SY06-07 Student Outcomes POSITIVE OUTCOMES (67%) • 10% received a High School Diploma • (47% of 12th graders received diplomas) • 24% attained ISP goals • 32% made progress toward ISP goals • 1% earned a GED NEGATIVE OUTCOMES (9%) • 6% dropped out of school • 3% were expelled from school NEUTRAL OUTCOMES (25%) • 13% transferred to another educational setting prior to completion • 12% did not make progress toward ISP goals (but remained in school attached to an educational program)
Origin of the Profile Project • PROBE • Governor’s Office of Management & Budget • All funded programs examined • Goals, accountability, mission, purpose, effectiveness • Indiana alternative education rating: ADEQUATE (barely)
Origin of the Profile Project • Funding cuts • Statute allows up to $750 per FTE • Currently receiving $551 per FTE • Block grants
Purpose of the Profile Project • Appropriate accountability measures • Tell the programs’ stories • Make information more accessible to parents and the community
Desired Outcomes • Increase accountability • Increase understanding of effective practices • Increase community awareness of alternative education effectiveness • Persuade legislators of the positive impact of alternative education
Partnership to Build the Profiles Center for Evaluation & Education Policy (CEEP) • Indiana University—years of experience with alternative education • Create/pilot surveys, maintain sites, develop profiles • Help develop evaluation system • Initial cost: $50,000; further years: $16,500
Accountability Components • Administrator Survey • Teacher Survey • Student Survey • Site Visits • DOE-AL Report
Administrator Survey • Program description • Goals-program specific • Program components • Services • Entrance/exit criteria
Goals • Academic Goals • Behavioral Goals • Self-managed Goals • Measurable & more standardized • Set by program • Report progress annually • Able to link to type, services and outcomes
Teacher Survey Purposes: • Identify usages of assessment data and service plans • Verify instructional strategies • Identify perceived levels of student support • Identify professional development opportunities • Identify perceived levels of community and parent outreach and support
Teacher Survey Results (06-07) • ISP’s are used frequently, but not always (as required by law) • Programs frequently use heterogeneous student grouping, one-to-one tutoring, and interactive learning • Types 2, 3, and 4 programs often share decision making with parents & community partners; Type 1 programs rarely do so • The majority of teachers report a strong sense of school community (lowest in Type 2)
Student Survey • Identify perceived levels of instructional support • Verify instructional strategies and uses • Identify perceived levels of student success and engagement
Initial Student Survey Issues • Low student participation • Survey too long • Survey complicated for younger students • Survey law/policies • Appropriate questions for all program types SOLUTIONS: • Earlier opening date • Cut questions • Simplify questions • Rephrase questions or create type-specific questions
Student Survey Results (07-08) • 62.1% of participating students plan to go to post-secondary education Since I’ve come to the alternative school: • I feel respected and supported: 3.7 (agree) • I care about my alternative school: 3.6 (agree) • I think it is important to get good grades: 4.4 (agree/strongly agree)
Student Survey Results (continued) • Type 4 programs tended to score highest across the board • Type 1 programs tended to score lowest • A couple of surprises: • Preparing for college: Type 2 • Understanding yourself: Type 1 • Continuing your education: Type 2
Site Visits • See the program in action! • All new programs; others on a 5-year cycle • Rubric (evidence required) • Results posted to Website • Will become part of profile
DOE-AL Report • Student data connected to Student Test Number (STN) • Report eligibility criteria & outcome for each student • Can be tied to graduation, ISTEP+ & GQE, suspension/expulsion, race/ethnicity, special education, gender, free/reduced lunch, etc.
Putting It All Together (The Program Profile) • Connect surveys, site visit reports, and outcome data (DOE-AL) to present a local profile. • Create “report card” for alternative ed programs • Connect outcome data to program type to determine effective formats and components.
Dr. Ken Springer ACCESS School Mission Statement Purpose of the Program What makes this program unique? Student/Teacher Ratio Goals of the Program
Each alternative education school/program in the state of Indiana is evaluated by staff of the Indiana Department of Education’s Office of Student Learning Choices. Each alternative education school/program receives a letter grades based on the following: Customer Satisfaction; Service Delivery; and Program Effectiveness. Evaluation Report Outcomes
Next Steps • Work with CEEP to create/post profiles • Develop accountability indicators • Create searchable database related to programming, program type, and outcomes • Implement research-based interventions • Create exemplary program award
CONTACT INFORMATION Molly Chamberlin 317-232-0579 or mchamber@doe.in.gov Kim Clement kclement@doe.in.gov