Download
1 / 42
440 likes | 690 Views
fMRI of speech and language. Rajeev Raizada raizada@u.washington.edu Institute for Learning and Brain Sciences, University of Washington . The human brain: now accessible to study. So far, you’ve learned a lot about behaviour Speech perception , speech production

E N D
fMRI of speech and language Rajeev Raizada raizada@u.washington.edu Institute for Learning and Brain Sciences, University of Washington
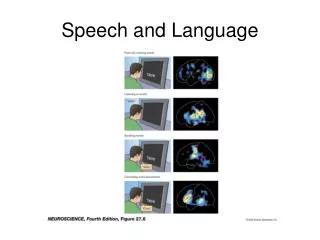
The human brain: now accessible to study • So far, you’ve learned a lot about behaviour • Speech perception, speech production • The brain is what underlies behaviour • How does the human brain produce and perceive speech? • In the past… • We could only study the brains of animals and dead people. They don’t talk much. • Within the last 10-15 years… • New tools have allowed us to study the living human brain, while it is producing and perceiving speech
Aims of this lecture • Give an broad overview of some of the recent tools that let us study the live human brain in action, in particular fMRI • What questions can these new tools help us answer? • What questions can we NOT answer? • How can this help us to understand speech? • Show one or two examples (Kim et al., Nature, 1997) • Discuss questions you have about the brain (e.g. is it true that we only use 10%, etc.)
Speech and the brain: What do we want to ask, what can we answer? • A few things it would be nice to know… • How on earth does this piece of meat between my ears manage to talk? And understand? • My patient’s language is impaired. What in his brain is causing the problem? Can I fix it? • The brain can handle speech brilliantly. Can I build the brain’s tricks into a computer? • How do we learn language? What changes occur in our brain when we learn language? Can neuroscience help us learn faster or better?
MRIMagnetic Resonance Imaging • Takes a 3D picture of the inside of body, completely non-invasively • One picture, just shows the structure http://www.coppit.org/brain/
fMRIfunctional Magnetic Resonance Imaging • Shows brain activity (indirectly) • Takes a series of pictures over time, e.g. one every three seconds • The “f” in fMRI means functional, i.e. you get a movie of brain function, not a still image of brain structure http://www.fmrib.ox.ac.uk/image_gallery/av/
Language areas in the brain • Some brain areas are specialised for language • Broca’s area: speech production • Wernicke’s area: speech perception • On the left side of the brain (in 95% of people) • This is pretty much the only left-brain / right-brain saying that is actually true • What does “specialised for language” actually mean? • If you lose these areas, you lose language • When you use language, you use those areas • BUT: That does not mean that they only do language • E.g. Broca’s area may be involved in music perception
Broca’s area: crucial for speech production • Paul Broca (1861): patient "Tan” • Severe deficit in speech production: could only say “tan” • Good language comprehension • Tan’s brain: lesion (injury) in left frontal cortex
Auditory cortex and Wernicke’s area • Auditory cortex: all sounds pass into here • Mostly specialised for low-level features, e.g. raw frequency • Bilateral (on both left and right sides of the brain) • Wernicke’s area (Carl Wernicke, 1874) • Patient with very poor speech comprehension • Good speech production • Lesion on left side, just behind auditory cortex • Specialised for processing “higher level” sounds: speech
Auditory cortex and Wernicke’s area From http://www.physiology.wisc.edu/neuro524/
Language areas in the brain From University of Washington’s Digital Anatomist project
Broca’s and Wernicke’s: Summary, some tentative conclusions • Lesion (injury) studies: • Show that a brain area is necessary for a given task • Without Broca’s area, you can’t produce speech • Without Wernicke’s area, you can’t understand speech • Returning to same/different parts of brain question: • Speech production and perception are centered in different areas, suggesting that different processes may underlie them • But Broca’s and Wernicke’s are connected to each other • Wernicke’s speech perception area is close to, but not inside of, primary auditory cortex • Speech perception is not just plain old auditory processing
Broca’s and Wernicke’s: Questions for possible fMRI studies? • Lesion studies leave a lot of questions open! • Are other areas involved in these speech tasks? • Are these areas involved in other language functions? • How do these areas function in an intact, uninjured brain? • What’s going on inside these areas? • What kinds of representations of speech do they have? • Can fMRI address some of these questions? • Measure brain activity while perceiving or producing speech • But first need to know: what is fMRI actually measuring?
What are we actually measuring with fMRI? • An MRI machine is just a big magnet (30,000 times stronger than Earth’s magnetic field) • The only things it can measure are changes in the magnetic properties of things inside the magnet: in this case, your head • When neurons are active, they make electrical activity, which in turns creates tiny magnetic fields • BUT far too small for MRI to measure (100 million times smaller than Earth’s magnetic field) • So, how can we measure neural activity with MRI?
What makes fMRI possible:Don’t measure neurons, measure blood • Two lucky facts make fMRI possible • When neurons in a brain area become active, extra oxygen-containing blood gets pumped to that area. Active cells need oxygen. • Oxygenated blood has different magnetic properties than de-oxygenated blood. Oxygenated blood gives a bigger MRI signal • End result: neurons fire => MRI signal goes up • This fMRI method is known as BOLD imaging: Blood-Oxygenation Level Dependent imaging. Invented in 1992.
But neurons do the real work, not blood. Neurons represent and process information • Individual nerve cells (neurons) represent information • Sensitive to “preferred stimuli”, e.g. /ba/ • These stimuli make them active • Firing activity: send electrical spikes to other neurons /ba/ /ba/-sensitive neuron
Populations of neurons process information together • Information is distributed across large populations of neurons, and across brain areas • There’s no “grandmother cell”: the one single cell that recognizes your grandmother • To really understand the brain, we’d need somehow to read the information from millions of individual neurons at once!
Problem 1: Neurons are fast, blood is slow • Neurons can send and receive signals in just a few milliseconds • Important events in the world happen in tens of milliseconds, and neurons can handle them. e.g. duration of formant transitions • The blood-flow response to neural firing takes around six seconds to get going, and around 18 seconds to finish
Problem 2: Neurons are small, MRI measures are big • 100,000,000,000 neurons in the brain • Each neuron around one hundredth of a millimeter • Typical fMRI voxel size: 3mm x 3mm x 5mm • A “voxel” is the 3D version of a pixel • So, in fMRI, we are measuring average activity of literally millions of neurons • Neighbouring neurons might be representing different things. E.g. we might be averaging together signals from /ba/ neurons and /da/ neurons
Don’t despair!fMRI experiments can answer meaningful questions about the brain…But it’s not easy to come up with good designs • Some cases where fMRI activation can tell us about the brain’s mechanisms • Different parts of brain active => Different mechanisms operating • Same parts of brain active =>Maybe same mechanisms operating • Example from before: is speech processed just like any other sound? • Example coming up: Is first-language processed same as second? • Presence of brain activation suggests operation of process • Example: lipreading, with no sound. Auditory cortex lights up! • Suggests that looking at lips doesn’t just feel like you’re trying to hear the speech, you really are invoking auditory processes (Calvert et al., Science, 1997)
Example relating brain to behaviour: Remediating dyslexia • Several groups have shown that training programs for dyslexic children can improve their reading, and make their brain activation become more similar to activation in normal readers • Including Virginia Berninger, Elizabeth Aylward, Todd Richards here at UW • BUT: not all kids improve in such training programs • Open question: • Can we predict, using fMRI, which kids will benefit from training, and which will not? Maybe the two groups will have similar pre-training reading scores, but dissimilar patterns of brain activation? • Can ask same question for, e.g. which patients will respond to this anti-depressant drug?
The basic design of an fMRI experiment • Aim: • Find which brain areas are active during a given task • E.g. discriminating speech sounds, producing speech • Typical design: • Present blocks, e.g. 30s of task, 30s of rest • Measure fMRI activity regularly every few seconds • Look for brain areas which are more active during the task periods, compared to rest periods
Example time-courses Time-course of task versus rest periods Task Task Rest Rest Rest MRI signal from voxel that correlates well with task: Active Signal from voxel that does NOT correlate with task: Inactive TIME
What are those little coloured blobs, actually? Colour represents statistical significance of how well the voxel’s activation correlates with the task. • The hi-res grayscale anatomical picture underneath the coloured blobs is a completely different type of image, from a different type of scan. Shows the anatomy at the spot where the significant voxel’s time-course was recorded.
Case study: Kim et al., Nature, 1997 • Thanks to Tobey Nelson for the following slides
Introduction • Goal • Examine cortical representations of native language (L1) and second language (L2) in bilinguals • Questions addressed • How are multiple languages represented in the brain? • Common or separated areas for L1 and L2? • Same patterns for early and late bilinguals? • Same patterns in Broca’s and Wernicke’s areas?
Method • Imaging technique: fMRI • Subjects • 6 “early” bilinguals – acquired two languages simultaneously as infants • 6 “late” bilinguals – exposed to L2 at 11, achieved conversational fluency at 19 • Tasks • Silent sentence-generation (internal speech) in L1 and in L2 • Analysis • Do the L1 and L2 activations overlap? • Measure distance between L1 and L2 activation centers
Results: Broca’s in a typical “late” bilingual • Broca’s area: spatially separated activations in for L1 and L2 NB: Left side of brain is on right side in all these images
Results: Broca’s in all “late” bilinguals • Spatially different areas in Broca’s area for L1 and L2 in all “late” bilinguals, across languages
Results: in “early” bilinguals, L1 and L2 overlap in Broca’s area
Results: L1 and L2 overlap in Wernicke’s, both for “early” and “late” bilinguals • L1 and L2 activate a shared region in Wernicke’s area
Summary of Kim et al. study • Conclusions • If you learn a second language early, it can cohabit with your first language in Broca’s area • But if you learn it late, the second language needs to find its own space • Possible interpretations: • The brain is more plastic for language early in life • Neural commitment: once Broca’s is committed to the first language, it’s hard to de-commit it • Questions: • If L1 and L2 activate different areas, does that mean that they are being processed differently? • If they activate the same area, does it mean that they are being processed in the same way? By the same neurons?
fMRI compared to other neuroimaging techniques (1) • fMRI • Measures changes in blood oxygenation caused by changes in neural activation • Big, expensive, loud. But lots of scanners • Magnetoencephalography (MEG) • Measures tiny magnetic fields caused by neural activity • Big, expensive, but at least not loud • Not many scanners. Requires magnetically shielded room • Electro-encephalography (EEG), Event-Related Potentials (ERPs) • Measures small electric fields on scalp caused by neural activity • Fairly small, comparatively cheap • Can attach electrodes to head in cap, works well with babies
fMRI compared to other neuroimaging techniques (2) • Big advantage of fMRI: good spatial resolution • Can record from a specified voxel inside the head • MEG and EEG record from outer surface of head, making it difficult to figure out where within the head the measured signals originated from • Spatial smearing of signal is worse for EEG than MEG. Electric fields spread around through head and skin, magnetic fields don’t • But even an fMRI voxel contains millions of neurons! • Big disadvantage of fMRI: poor time-resolution • Blood is slow (seconds) but neurons are fast (milliseconds) • MEG and EEG measure neural signals directly, millisecond resolution • Take-home message: • Different methods let you ask different questions
Varieties of neuroimaging TMS PET EEG/ERPs MEG cm mm microns fMRI Spatial resolution MRI Single-neuron electrophys ms seconds minutes Temporal resolution
fMRI of language in 5-year-old children:How does brain relate to behaviour? 5 year-olds are just about to start school and learn to read Some interesting questions (most of which we don’t have answers to, yet) • Peer into a child’s brain, peer into that child’s future? • What are their language skills? • How is their brain processing language? • How big a factor is their environment (Socio-Economic Status) ? • Which measures might predict subsequent language problems?
Measure brain, measure behaviour, see how they relate Behavioural measures: • Battery of standardised language and IQ tests • Thank you to Anika for having led much of the testing! • Peabody Picture Vocabulary Test • Phonological Abilities Test (PAT) • Clinical Evaluation of Language Fundamentals test (CELF) • Wechsler Preschool and Primary Scale of Intelligence (WPPSI) • Measure of Socio-Economic Status (SES): Hollingshead scale Brain measures: • fMRI of kids performing rhyme and tone judgments • Rhyming task: hear two words, press a button if they rhyme
How to convince a small child to lie still inside a noisy metal tube MRI scanners are big, noisy tubes. Kids need to keep heads still • Secret weapon #1: Kids visit first to practice in simulated scanner • Secret weapon #2: Katie and Sally’s calm and soothing manner • Out of 30 kids: 14 successful scans with good quality images
Results (Part 1): Activation of language areas Left inferior frontal cortex Approx. location of Broca’s area • Shows activation during rhyming task • Surprisingly clean group-average activation, especially for kids Left superior temporal cortex Auditory cortex, Wernicke’s area
Results (Part 2): Correlation between SES and Broca’s Hemispheric specialisation • Language areas, including Broca’s area, are on the left side of brain • The more developed the language areas, the greater the left/right asymmetry • Measure of specialisation: activation difference between left and right sides
But what does it all mean? • What are the links between SES and language? • Parental vocabulary and syntax • Less exposure to reading, fewer books in the home • Environmental factors that impair cognition broadly: • Nutrition, stress, health care etc. • Does low SES cause language problems? • How would you design a study to test for a causal link?
Some links • Eric Chudler, UW faculty, has a very interesting webpage about the myth that we use only ten percent of our brains • http://faculty.washington.edu/chudler/tenper.html • Jody Culham’s website: lectures from an excellent introductory course: “fMRI for Newbies” • http://psychology.uwo.ca/culhamlab/Jody_web/fmri4newbies.htm • The Digital Anatomist, from UW’s Dept. of Biological Structure. Lots of great brain pictures, with addable labels for the different structures • http://www9.biostr.washington.edu/da.html Brain Voyager Brain Tutor: Free 3D brain tutorial, for Mac or Windows http://www.brainvoyager.de/Downloads.html This lecture:http://faculty.washington.edu/raizada/fMRI_speech_lecture_June2006/