Download
1 / 48
490 likes | 1.05k Views
Peter Langfelder Dept. of Human Genetics, UC Los Angeles Work with Steve Horvath. Consensus eigengene networks: Studying relationships between gene co-expression modules across networks. Road map. Overview of Weighted Gene Co-expression Networks Network construction

E N D
Peter Langfelder Dept. of Human Genetics, UC Los Angeles Work with Steve Horvath Consensus eigengene networks:Studying relationships between geneco-expression modules across networks
Road map Overview of Weighted Gene Co-expression Networks • Network construction • Gene co-expression modules • Module eigengenes Differential analysis of several networks at the level of modules • Consensus modules and their eigengenes • Consensus Eigengene Networks • Applications: Expression data from • Human and chimpanzee brains, • Four mouse tissues
Weighted Gene Co-Expression Network Analysis Bin Zhang and Steve Horvath (2005)"A General Framework for Weighted Gene Co-Expression Network Analysis", Statistical Applications in Genetics and Molecular Biology: Vol. 4: No. 1, Art. 17.
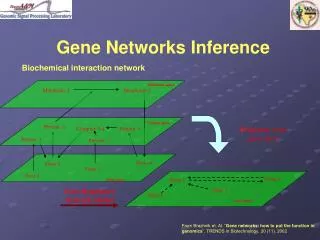
Network = Adjacency Matrix • Adjacency matrix A=[aij] encodes whether/how a pair of nodes is connected. • For unweighted networks: entries are 1 (connected) or 0 (disconnected) • For weighted networks: adjacency matrix reports connection strength between gene pairs
Overview: gene co-expression network analysis Steps for constructing aco-expression network Get microarray gene expression data Do preliminary filtering Measure concordance of gene expression profiles by Pearson correlation C) The Pearson correlation matrix is either dichotomized to arrive at an adjacency matrix unweighted network ...Or transformed continuously with the power adjacency function weighted network
Power adjacency function to transform correlation into adjacency To determine β: in general use the “scale free topology criterion” described in Zhang and Horvath 2005 Typical value: β=6
Comparing adjacency functions Power Adjancy (soft threshold) vs Step Function (hard threshold)
Why weighted? • A continuous spectrum between perfect co-expression and no co-expression at all • Could threshold, but will lose information • Instead, assign a weight to each link that represents the extent of gene co-expression • Natural range of weights: 0=no connection, 1=perfect agreement.
Central concept in network methodology: Network Modules • Modules: groups of densely interconnected genes (not the same as closely related genes) • a class of over-represented patterns • Empirical fact: gene co-expression networks exhibit modular structure
Module Detection • Numerous methods exist • Many methods define a suitable gene-gene dissimilarity measure and use clustering. • In our case: dissimilarity based on topological overlap • Clustering method: Average linkage hierarchical clustering • branches of the dendrogram are modules
Topological overlap measure, TOM • Pairwise measure by Ravasz et al, 2002 • TOM[i,j] measures the overlap of the set of nearest neighbors of nodes i,j • Closely related to twinness • Easily generalized to weighted networks
Calculating TOM • Normalized to [0,1] with 0 = no overlap, 1 = perfect overlap • Generalized in Zhang and Horvath (2005) to the case of weighted networks
Example of module detection via hierarchical clustering Example of module detection via hierarchical clustering • Expression data from human brains, 18 samples.
Why are modules so important? • Functional: expected to group together genes responsible for individual pathways, processes etc., hence biologically well-motivated • Useful from a systems-biological point of view: bridge from individual genes to a systems-level view of the organism • For certain applications, modules are the natural building blocks of the description, e.g., study of co-regulation relationships among pathways • Help alleviate the multiple-testing problem (ambiguity) of finding genes significantly correlated with phenotypes
Module eigengenes • Often: Would like to treat modules as single units • Biologically motivated data reduction • Construct a representative • Our choice: module eigengene =1st principal component of the module expression matrix • Intuitively: a kind of average expression profile • Genes of each module must be highly correlated for a representative to really represent
Example Human brain expression data, 18 samples Module consisting of 50 genes
Module eigengenes are very useful! • Summarize each module in one synthetic expression profile • Suitable representation in situations where modules are considered the basic building blocks of a system • Allow to relate modules to external information (phenotypes, genotypes such as SNP, clinical traits) via simple measures (correlation, mutual information etc) • Can quantify co-expression relationships of various modules by standard measures
Construct network Tools: Pearson correlation, Soft thresholding Rationale: make use of interaction patterns between genes Identify modules Tools: TOM, Hierarchical clustering Rationale: module- (pathway-) based analysis Find one representative for each module Tools: eigengene (1st Principal Component) Rationale: Condense each module into one profile Further analysis Module relationships, module significance for traits, causal analysis etc.
What is different from other analyses? • Emphasis on modules (pathways) instead of individual genes • Alleviates the problem of multiple comparisons: ~10 instead of ~10k comparisons • Module definition is based on gene expression data • No prior pathway information is used for module definition • Emphasis on a unified approach for relating variables • Default: power of a correlation
Differential analysis • In many applications: useful information comes from comparing data obtained under different conditions • Example: differential gene expression in healthy and diseased tissues to find genes related to the disease • Very little in the literature on differential analysis of networks: work on differential connectivity and crude masures of module preservation • Network differential analysis has the potential of yielding interesting information
Differential analysis of networks(commonalities and differences)at the level of modules Goal of this work:
Why? • To understand commonalities and differences inpathway regulation • It is possible that some conditions are caused (or accompanied) by changes in co-regulation that are invisible to single gene based analysis
Typical scenario • Two (or more) microarray gene expression data sets • Genes (probes) must be the same or be matched • Samples need not be the same, sets may have different sizes • Some preprocessing may be needed to make networks comparable
Step 1: Findconsensus modules Consensus modules: modules present in each set Rationale: Find common functions/processes Set 1 Set 2 Individual set modules Consensus modules
Step 2: Represent each module by its Module Eigengene Pick one representative for each module in each set – we take the eigengene Consensus modules Consensus module eigengenes
Step 3:Networks of module eigengenesin each set • Module relationship = Cor(ME[i], ME[j]) (ME:Module eigengene) • Comparing networks: Understand differences in regulation under different conditions • Modules become basic building blocks of networks: ME networks Set 1 Set 2
Summary of the methodology:Consensus eigengene networks • Individual set modules • Consensus modules • Consesus eigengenes • Consensus eigengene networks
Consensus modules:Definition Individual set modules: groups of densely interconnected genes Consensus modules: groups of genes that are denselyinterconnected in each set
Consensus modules:Detection Modules in individual sets: Measure of gene-gene similarity (TOM) + clustering Consensus modules: Define a consensus gene-gene similarity measure and use clustering
Consensus similarity measure Set 1 Set 2
Consensus similarity measure Set 1 Set 2 Min
Caveats and generalizations • Often: different data sets may not be directly comparable. Must transform individual set similarities to make taking minimum meaningful • Majority instead of consensus: in some applications one may be interested in modules that are present in a majority of sets, not all: take average (median, etc) instead of minimum • Can define p-majority modules by taking the p-th quantile instead of minimum (p=0) or median (p=0.5) • Exclusive (as opposed to consensus) modules: modules present in set 1 and absent from set 2
Human and chimpanzee brain expression data • Construct gene expression networks in both sets, find modules • Construct consensus modules • Characterize each module by brain region where it is most differentially expressed • Represent each module by its eigengene • Characterize relationships among modules by correlation of respective eigengenes (heatmap or dendrogram)
Biological information? Assign modules to brain regions with highest (positive) differential expression Red means the module genes are over-expressed in the brain region; green means under-expression
What did we learn that's new? • Preservation of modules across the primate brains and their relationships to brain regions was described by Oldham et al 06. • Challenge: The authors did not study the relationships between the modules. • Solution: study module relationships using eigengene networks
Visualizing consensus eigengene networks • Heatmap comparisons of module relationships
Eigengene network visualization (II) Module dendrograms show clusters of modules with high co-expression
Consensus modules across 4 mouse tissues • Consensus analysis of expression data from liver, brain, muscle, adipose tissues, BXH mouse cross • Data from lab of Prof. Lusis, UCLA • ~130 samples for each tissue; 3600 genes in each network • Performed Functional Enrichment Analysis
Consensus modules across 4 mouse tissues 11 modules in total
Conclusions Weighted gene co-expression networks • Tool for studying co-expression patterns in high throughput data • Module analysis: a biologically motivated data reduction scheme Differential analysis at the level of modules • Consensus modules (modules present in all sets): study common pathways • Eigengene networks (comprised of module eigengenes): study commonalities and differences in regulation • Applications: Consensus eigengene networks are robust and encode biologically meaningful information
For more information Weighted Gene Co-expression Networks website: http://www.genetics.ucla.edu/labs/horvath/CoexpressionNetwork/
A short methodological summary of the publications. • How to construct a gene co-expression network using the scale free topology criterion? Robustness of network results. Relating a gene significance measure and the clustering coefficient to intramodular connectivity: • Zhang B, Horvath S (2005) "A General Framework for Weighted Gene Co-Expression Network Analysis", Statistical Applications in Genetics and Molecular Biology: Vol. 4: No. 1, Article 17 • Theory of module networks (both co-expression and protein-protein interaction modules): • Dong J, Horvath S (2007) Understanding Network Concepts in Modules, BMC Systems Biology 2007, 1:24 • What is the topological overlap measure? Empirical studies of the robustness of the topological overlap measure: • Yip A, Horvath S (2007) Gene network interconnectedness and the generalized topological overlap measure. BMC Bioinformatics 2007, 8:22 • Software for carrying out neighborhood analysis based on topological overlap. The paper shows that an initial seed neighborhood comprised of 2 or more highly interconnected genes (high TOM, high connectivity) yields superior results. It also shows that topological overlap is superior to correlation when dealing with expression data. • Li A, Horvath S (2006) Network Neighborhood Analysis with the multi-node topological overlap measure. Bioinformatics. doi:10.1093/bioinformatics/btl581 • Gene screening based on intramodular connectivity identifies brain cancer genes that validate. This paper shows that WGCNA greatly alleviates the multiple comparison problem and leads to reproducible findings. • Horvath S, Zhang B, Carlson M, Lu KV, Zhu S, Felciano RM, Laurance MF, Zhao W, Shu, Q, Lee Y, Scheck AC, Liau LM, Wu H, Geschwind DH, Febbo PG, Kornblum HI, Cloughesy TF, Nelson SF, Mischel PS (2006) "Analysis of Oncogenic Signaling Networks in Glioblastoma Identifies ASPM as a Novel Molecular Target", PNAS | November 14, 2006 | vol. 103 | no. 46 | 17402-17407 • The relationship between connectivity and knock-out essentiality is dependent on the module under consideration. Hub genes in some modules may be non-essential. This study shows that intramodular connectivity is much more meaningful than whole network connectivity: • "Gene Connectivity, Function, and Sequence Conservation: Predictions from Modular Yeast Co-Expression Networks" (2006) by Carlson MRJ, Zhang B, Fang Z, Mischel PS, Horvath S, and Nelson SF, BMC Genomics 2006, 7:40 • How to integrate SNP markers into weighted gene co-expression network analysis? The following 2 papers outline how SNP markers and co-expression networks can be used to screen for gene expressions underlying a complex trait. They also illustrate the use of the module eigengene based connectivity measure kME. • Single network analysis: Ghazalpour A, Doss S, Zhang B, Wang S, Plaisier C, Castellanos R, Brozell A, Schadt EE, Drake TA, Lusis AJ, Horvath S (2006) "Integrating Genetic and Network Analysis to Characterize Genes Related to Mouse Weight". PLoS Genetics. Volume 2 | Issue 8 | AUGUST 2006 • Differential network analysis: Fuller TF, Ghazalpour A, Aten JE, Drake TA, Lusis AJ, Horvath S (2007) "Weighted Gene Co-expression Network Analysis Strategies Applied to Mouse Weight", Mammalian Genome. In Press • The following application presents a `supervised’ gene co-expression network analysis. In general, we prefer to construct a co-expression network and associated modules without regard to an external microarray sample trait (unsupervised WGCNA). But if thousands of genes are differentially expressed, one can construct a network on the basis of differentially expressed genes (supervised WGCNA): • Gargalovic PS, Imura M, Zhang B, Gharavi NM, Clark MJ, Pagnon J, Yang W, He A, Truong A, Patel S, Nelson SF, Horvath S, Berliner J, Kirchgessner T, Lusis AJ (2006) Identification of Inflammatory Gene Modules based on Variations of Human Endothelial Cell Responses to Oxidized Lipids. PNAS 22;103(34):12741-6 • The following paper presents a differential co-expression network analysis. It studies module preservation between two networks. By screening for genes with differential topological overlap, we identify biologically interesting genes. The paper also shows the value of summarizing a module by its module eigengene. • Oldham M, Horvath S, Geschwind D (2006) Conservation and Evolution of Gene Co-expression Networks in Human and Chimpanzee Brains. 2006 Nov 21;103(47):17973-8