Download
1 / 14
140 likes | 502 Views
2000 Financial Results in accordance with International Accounting Standards Principles of Reconciliation The IAS financials results have been prepared based on the Russian Accounting Standards financial reports Currency of reporting – Russian rouble (RuR)

E N D
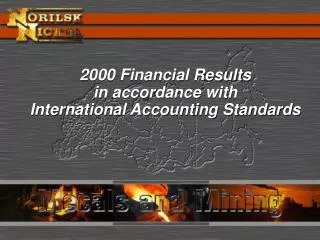
2000 Financial Results in accordance with International Accounting Standards
Principles of Reconciliation • The IAS financials results have been prepared based on the Russian Accounting Standards financial reports • Currency of reporting – Russian rouble(RuR) • Accounting in a hyperinflation environment - IAS 29 • Inflation over the last 3 years was close to 100% • The population prefers to keep its savings in a foreign currency • Payments by credit are priced at levels compensating for the purchasing power loss over the term of the credit • average annual inflation indexin 2000: 1,088 • IAS review has been prepared by KPMG auditors
Income Statement -RuR millions -2000 1999 Change Sales 152 989 94 142 +63% International sales 136 335 89 071 +53% Domestic sales 16 654 5 071 +228% Cost of goods sold and SG&A 77 572 48 251 +61% Operating profit 67 109 35 972 +87% Profit tax 12 967 23% 15 915 Net income 40 089 17 249 +132%
Revenues (RuR millions) +63% 1999 2000 Note: 2000 changes are in brackets
Financial Performance Gross Profit Margin EBIT Margin Net Income Margin 1998 1999 2000 1998 1999 2000 1998 1999 2000
Cost of Goods Sold • Operations: • Production growth and inflation: • Growth of costs of purchased materials • Growth of costs of electricity and fuel • Increase in costs of servicing machines and equipment • Growth in salaries • Norimet consolidation: • Resulted in third party sales and third party purchases, amortization of goodwill and a revaluation of Norimet inventories to the cost of purchase. This revaluation was due to the difference in accounting of Norilsk Nickel and Norimet. Norilsk Nickel accounts for its inventories at the cost of purchase, while Norimet was accounting stockpiles of metals at current market prices.
Financial Performance Return on Assets Return on Shareholders’ Equity EPS 32.1% 22.4% 20.7% 15.3% 12.3% 7.5% 188 RuR 91 RuR 0.56 RuR 1998 1999 2000 1998 1999 2000 1998 1999 1999 2000
Key Balance Sheet Items - RuR millions -20001999 Cash and cash equivalents16 8868 818 Property, plant and equipment 81 318 70 225 Inventories34 307 25 709 Shareholders Equity, 125 07277 103 as % of balance sheet 64,4% 55,0% Credits and loans29 217 16 557
Key Balance Sheet Items • Operations: • Growth in cash(byRuR 8 billion) • Growth in inventories (RuR 8,6 billion ) due to increase in purchased materials byRuR 9,4 billion • Growth in accounts receivable (RuR 13,5 billion) due to increase in VAT receivables from the state (RuR 6,3 billion) • Growth in accounts payable (RuR 0,8 billion) • Norimet Consolidation: • Increase in credits and loans by RuR 8,3 billion • Increase in intangibles byRuR 5,5 billion (goodwill) • Increase in inventories by RuR 7,1 billion • Increase in accounts payable (RuR 0,6 billion) and accounts receivable (RuR 13,2 billion)
Cash Flows - RuRmillions - (5 002) 19 044 10 984 (24 046) (4 917) 7 585 9 211 8 069 15 901 (3 399) 14 213 7 078 8 069 (1 143) (507) 7 078 FinancingsActivities Capital Assets Revaluation Net increase in cash and cash equivalents Operating Activities Investing Activities 1999 2000
Cash Flows (continued) • Operating Activities: • Payback of tax arrearsfor the previous years (RuR 6,9 billion) • Norimet consolidation: the calculation of the change in inventories, receivables and payables of the Group reflects the acquisition of Norimet • Investing Activities: • Capital expenditures totaled RuR 18,0 billion, by 280% more than in 1999 • The main targets for capital expenditures werethe following mines: «Oktyabrsk», «Kaula-Kotselvaara» and «Taimyrsk», Talnakh concentratorand Pelyatinskoyegas condensate mineral deposit • Acquisition of a stake in the Novolipetsk metallurgical plant (RuR 6,2 billion)
Capital Expenditures - RuR billions - Capital Expenditures (RAS*) 9.8 * Russian Accounting Standards
Capital Expenditures (continued) - RuR billions - Capital Expenditures (RAS) 9.8 -revaluation of inventories, construction-in-progress and other 7.2 - inflation 1.0 Capital Expenditures (IAS) 18.0
Prospects • Review of interim IAS 6 month and 9 month 2001 financials • Review of IAS 2001 financials • Audit of IAS financials starting 2002 • Restatement of interim (quarterly) financial reports starting 2002 and review of half-year results