Download
1 / 19
210 likes | 405 Views
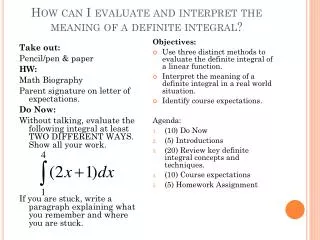
7.3: Area and the Definite Integral. Objective: To use area under a curve to evaluate the definite integral. If you traveled at a constant rate of 60mph for 2 hours, how far did you travel?. Let’s look at it graphically…. v(t) = 60 Total Distance = Area under the curve.

E N D
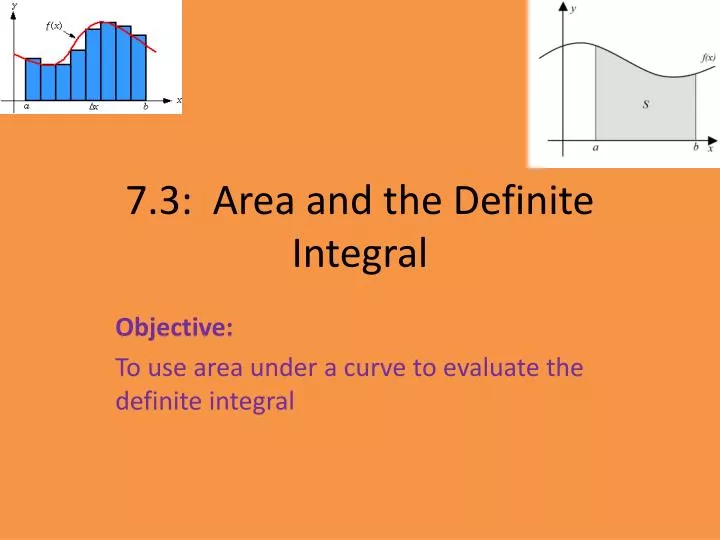
7.3: Area and the Definite Integral Objective: To use area under a curve to evaluate the definite integral
If you traveled at a constant rate of 60mph for 2 hours, how far did you travel? Let’s look at it graphically…. v(t) = 60 Total Distance = Area under the curve
Of course, not all graphs will be straight, horizontal lines!! • We can find the area under the curve by splitting up the interval into little rectangles with equal width and adding up the area of each rectangle If we have a function over [a, b]: WIDTH of rectangle= ∆x = , where n is # of subintervals HEIGHT of rectangle = value of function at either right endpoint, left endpoint, or midpoint of subinterval The more subintervals, n, you have, the more accurate your approximation!!
Riemann Sum sigma, indicates “the sum of” means the sum of f(xi) = value of the function ∆x = width of the interval, change in x
Estimate the area under the curve f(x) = x2 on [0,4]. Divide into 4 subintervals of equal length: Using Right endpoints, add up area of rectangles:
If one endpoint gives an overestimation and one gives an underestimation, you could avg the 2 answers. This is something called the trapezoidal rule (will discuss more later!!!)
Increasing Functions Decreasing Functions Right endpoint underestimates area, left endpoint overestimates Right endpoint overestimates area, left endpoint underestimates If function is both increasing and decreasing over interval, can’t really determine which gives over/underestimate
Estimate the area under the curve of f(x) = x3 -5x2+6x+5 on [0,4] using n= 5. Helps to sketch curve first:
As the # of rectangles increase without bound, the sum of the areas of these rectangles get closer and closer to the actual area of the region THE DEFINITE INTEGRAL If f is defined on the interval [a,b], the definite integral of f from a to b is given by: provided the limit exists, where ∆x=(b-a)/n and xi is any value x in the ith interval.
It is read as “the integral from a to b of f of x dx” Integrand (notice variable of integration) Upper limit (boundary) of integration Lower limit (boundary) of integration • When you find the value of the integral, you have evaluated the integral • The definite integral is a NUMBER
Definite Integral and Area Area under the curve is equal to the definite integral if f(x) > 0 (if f(x) is non-negative) if f(x) > 0
Evaluate the integral. 1. 2.
Total Change in F(x) If f(x) gives the rate of change of F(x) for x in [a,b], then the total change in F(x) as x goes from a to b is given by p. 460:#24