Download
1 / 5
50 likes | 168 Views
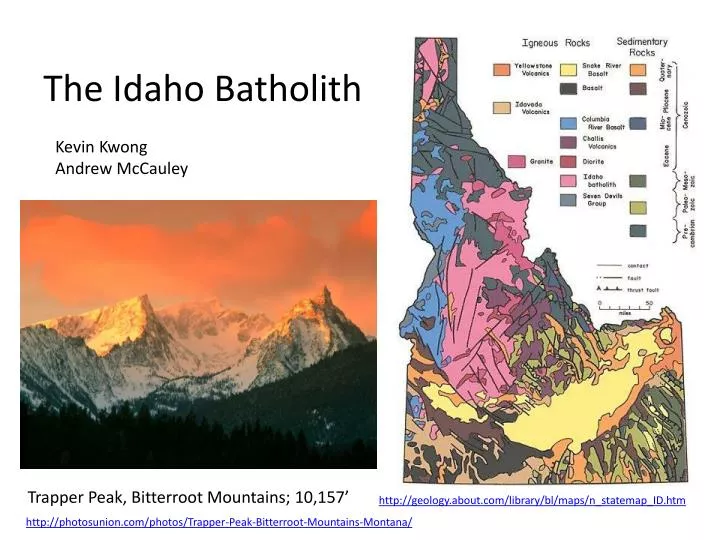
The Idaho Batholith. Kevin Kwong Andrew McCauley. Trapper Peak, Bitterroot Mountains; 10,157’. http://geology.about.com/library/bl/maps/n_statemap_ID.htm. http://photosunion.com/photos/Trapper-Peak-Bitterroot-Mountains-Montana/. ( Snee et al. 1995, fig. 10.28).

E N D
The Idaho Batholith Kevin Kwong Andrew McCauley Trapper Peak, Bitterroot Mountains; 10,157’ http://geology.about.com/library/bl/maps/n_statemap_ID.htm http://photosunion.com/photos/Trapper-Peak-Bitterroot-Mountains-Montana/
(Snee et al. 1995, fig. 10.28) (Foster et al. 2001, fig. 17)
(King and Valley 2001, fig. 8) Field photos of migmatite from eastern pluton border. A) ptygmatic granite veins feeding larger granite mass. B) anatecticplg, kspar, qtz, in gneiss. C) Anatectic vein with biotite. D) deformation enhanced melt migration suggested by vein size increase from right to left. (Foster et al. 2001, fig. 4) (Foster et al. 2001, fig. 12)
VELOCITY STRUCTURE AND LITHOSPHERE CONSTRAINTS OF THE IDAHO BATHOLITH REGION Figure Above: Map of Moho depth derived from H − stacking analysis. Red colors denote shallower Moho, blue colors denote deeper Moho. Geologic provinces include Cascade volcanic arc (CM), Blue Mountains (BM), High Lava Plains (HLP), Columbia River basin (CRB), Snake River Plain (SRP), Idaho batholith (IB), Owyhee Plateau (OP), Modoc Plateau (MP), and Great Basin (GB) Figure Above: Cross sectional view through tomographic model. Warm colors represent regions of reduced velocities and cool colors represent regions of increased velocities. Roth et al. 2008 Eagar et al. 2011
Porphyry Molybdenum deposits of the Idaho batholith area. (Worthington 2007, fig. 2) Figure Above: Tectonic model. A: During middle Cretaceous time, full magmatic arc developed in western Idaho . B: In Late Cretaceous time, while magmatic arc was still active, transpressional deformation in western Idaho shear zone resulted in east-west shortening. (Giorgiset al. 2005, fig. 4)