Download
1 / 63
640 likes | 775 Views
GlaxoSmithKline Confidential. Promotion Analysis System (PAS) PASNet Training. RTP: Wednesday, December 8, 2004 3:00-5:00 Bide B-2184 FP: Friday, December 10, 2004 11:00-2:00 with lunch See Monitor for Room Number. Jim Youngberg Analytic Resources and Tools

E N D
GlaxoSmithKline Confidential Promotion Analysis System (PAS)PASNet Training RTP:Wednesday, December 8, 2004 3:00-5:00 Bide B-2184 FP:Friday, December 10, 2004 11:00-2:00 with lunch See Monitor for Room Number Jim Youngberg Analytic Resources and Tools Bide C-3124 • RTP, NC 27709 Phone: 919•483•0248
Agenda TopicPresenterMinutes • Overview of the Promotion Analysis System Jim Youngberg 5-10 • Getting Started with PASNet Jim Youngberg 5-10 • New Features of the PASNet front-end Aparna Peri 30-45 FP Location • Lunch / Break / Open Discussion Everyone 30-45 • New Features of the PASNet output Jim Youngberg 30-45 • Tips and Strategies Jim / Aparna / Users 30-45 • Successful Jobs • Robust Analysis \\us0n47\dss\PASNET\Training\PASNet Training.ppt
Purpose of the PAS System • PAS was developed to automate the measurement of sales response to promotions and events that target physicians or are placed in physician offices. • Method • Pre/post change in Rx volume and share of participants vs. similar non-participants • Requirements • List of participating prescribers (to link their IDs with Rx history) • Start date per participant • Results • Incremental Rx volume projected up to post 24-months • Return on Investment (ROI) \\us0n47\dss\PASNET\Training\PASNet Training.ppt
Promotions Measured by PAS System • Physician Meetings and Events (PME): • Dinner Meetings and Lunches, Teleconferences, Web Conferences, Conferences, Symposia, Convention Booths, Satellite Broadcasts in healthcare facilities, group promotions in sport or entertainment venues, other group promotions. • In Office Media (IOM): • Wallboards, sample cabinets, magazine wraps, healthcare TV networks (Accent Health, ERN), ads on Rx pads, pens, clip boards, calendars, other DTC. • Patient and Staff Assistance programs in physician offices (PSA): • Alternative samples (coupons, vouchers), patient education displays and kits (CDs, videos), diagnostic tools, health tests and screens, compliance program enrollment, office staff education, visiting nurse educators, other materials. • Outbound and on demand physician promotions and materials (OOD): • Direct mail and e-mail messages to prescribers, faxes, telepromotions, post promotion follow-up calls, PDA messages, web detailing, internet detailing, requests for patient education kits and samples, other one-way or 1/1 prescriber promos. \\us0n47\dss\PASNET\Training\PASNet Training.ppt
Should not measure sales response to: • Non-promotional programs • Clinical Trial Participation • Regional Advisory Boards • Paid Speakers and Speaker Training • CME (medical education credits), grants and independent programs • Distribution of journal articles and research publications • Physician activities at consumer events when • there is a long-time period between diagnosis and Rx treatment • consumers can make appointment with any other physician • majority of target sufferers is not reached • Pre-launch activities and long-term goals \\us0n47\dss\PASNET\Training\PASNet Training.ppt
Disease Awareness and Unbranded Promotions • Analyze impact on the narrowly defined therapeutic class (e.g., inhaled steroids, anxiety) • Provide performance summary of all brands (e.g., share change bar graph) • Provide sales response & ROI for GSK brands, when approved and labeled for the advertized condition • Can’t provide ROI when there is no main objective to drive sales • Measure sales response/ROI of program tactics designed to drive product sales. \\us0n47\dss\PASNET\Training\PASNet Training.ppt
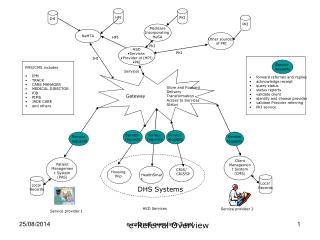
Prescriber/Participant List Prescriber target list generated internally by GSK Promotion participants provided by vendor through contract with GSK PRx Individual prescriber/payer data by month PPRx files with New Rxs and Total Rxs PRx Individual call reporting Call file with product details and samples GSK selling teams only PAS does not use co-promote data (e.g., PDI, Consumer Healthcare) at this time PRx Cross-Reference files (formats) Prescriber consensus specialty from CMS Region Alignments (retail teams in RTP and PHL) Does not have alignments for HIV, NeuroHealth, etc. Excluded from analysis PASNET cannot analyze Oncology or Vaccines Mail Order Rxs are not included The current Mail Order in PRx includes a "boost" factor from NDC to project from their (less than 45%) sample to the U.S. total. Both NDC and IMS recommend against projecting Mail Order for their prescriber-level data deliverables. Mail Order should probably be considered separately (as another criteria/measurement) from Retail. In general, a Mail Order Rx and a Retail Rx "captured" in our prescriber-level data have different values: Mail Order has a higher projection (or "boost") factor than Retail Mail Order tends to have a larger quantity of medicine per Rx than Retail If Mail Order is treated separately, we would be able to determine whether or not the promotional impact is either (A) detectable or (B) consistent across the Mail Order and Retail channels. This enhancement will require further research to demonstrate that Mail Order adds value and produces results of similar or greater accuracy. PASNET Data Sources \\us0n47\dss\PASNET\Training\PASNet Training.ppt
GlaxoSmithKline Confidential Promotion Analysis System (PAS) Instructions for Getting Started with PASNet
PASNet is a web-based application. Installation is not required. http://pharmanet.gsk.com/pasnet/ Data files are copied under the Job ID within your PASNet folder on the Q: drive \\us0n47\dss\PASNET\prod\users The PASNet output template is on the Q: drive \\us0n47\dss\PASNet\prod\Templates \\us0n47\dss\PASNet\prod\Templates\PASNET Output.xls This file is READ ONLY! Before you start using PASNet the first time, follow these steps. Run this presentation in slide show mode [F5 key]. Click on this link: \\us0n47\dss\PASNet\prod\Templates Click on the PASNET.exe file This will create a PASNET directory in “C:\PASNet” on your hard drive with links to the directories and/or files from above Click [OK] at the next 2 message boxes Click [Unzip], followed by [OK] and [Close] Where are the PASNet files? PASNet \\us0n47\dss\PASNET\Training\PASNet Training.ppt
Types of PASNet Jobs PASNet • Match Job • Selects Controls (“paired twins”) for the promotion participants. • Paired Analysis • Analyzes Participant and Control physician activity (Rxs, Details, and Samples) relative to the promotion month. • Both Match & Paired Analysis • Run Match Job followed by Paired Analysis in sequence. • Unpaired Analysis • Analyzes Rx and Call data for participants relative to all pre-selected Controls. (Each participant is compared to all Controls.) • Find CID • Finds current CID number for a participant list based on a prescriber’s Name, Address, City, State, Zip Code, and Phone Number. \\us0n47\dss\PASNET\Training\PASNet Training.ppt
Types of Prescriber Lists Paired Analysis Participant Attended the promotion --> Compare to matched control “twins” Exclude Will not be considered as a possible control “twin” Unpaired Analysis Participant Attendees for whom a random sample was held out before the promotion. Control Pre-selected holdout group to be used for the comparison. List Requirements All prescribers must have a CID Either load the CIDs directly from the Excel file or use “Find CID” to uniquely identify a CID for each prescriber Prescriber list must be in Excel format No spaces in the Sheet name! Column headings in the first row Participant lists must have a promotion date for each CID Promotion date formatted as a date 2-character postal abbreviation for States e.g., “NC”, “PA” 5-digit zip code, formatted as text with leading zeros No special characters (e.g., hard returns within a cell) Prescriber Lists PASNet Note: PASNet no longer uses the “Test” group designation. Instead, all physicians exposed to a promotion are referred to as “Participants”. They can be measured using either Paired Analysis or Unpaired Analysis. \\us0n47\dss\PASNET\Training\PASNet Training.ppt
PASNet Main Menu PASNet Lists • New List • Append to List • Copy List • Modify List http://us9n38.glaxo.com/pasnet/ 1 My Groupings • Specialty • Class RXs • Product Share • Details • Samples • Aggregates/ Trends Match or Analysis Parameters • Choose defaults or Select from “My Groupings” Match Criteria • New / Total Rx • Zip Code Digits • Payment Type • Controls per Participant 2 Jobs • Find CID • Match • Paired Analysis • Both Match & Paired Analysis • Unpaired Analysis 3 Output • Analysis • Parameters For Match/Analysis • Export CID List 4 \\us0n47\dss\PASNET\Training\PASNet Training.ppt
The Short PAS (I): Submitting a Match Job and Paired Job PASNet • Load a list of participants and validate the CIDs • Click Lists • Choose “New List” • Upload Excel file and create links to pre-defined variables • Run “Find CID” • Define Parameters (for Match and Analyze) • Click Match Parameters • Choose “Use As Analysis Parameters” • Choose from default groups • Specialties, Details, Samples, Class Rx, Product Share, Aggr/Trend weights, Rx Units, Number of Rxs, Zip Code level, and Payment Types • It’s not necessary to create custom groups using “My Groupings” • Submit PAS Job • Click Jobs • Click Both Match & Paired • Select Physician Attendee List created in Step 1 • Select Match/Analysis Parameters created in Step 2 • Click “Run Job” Continued on Next slide \\us0n47\dss\PASNET\Training\PASNet Training.ppt
The Short PAS (II): Getting the Results PASNet • Get output results • Click Output, Analysis, and choose the “Analysis Job Description” from Step 3 • Result: Text files are FTP’d to the Q: drive under your User ID and Job ID • Open the Excel template for Output • From the Excel template • Click the “Start” button • When prompted, type your User ID and Job ID (This information is needed to retrieve the output data.) • The data files will be added to the template. You will then be prompted to save the results to your hard drive under the Job ID in “C:\PASNet\Output” \\us0n47\dss\PASNET\Training\PASNet Training.ppt
MATCH:Selects Controls (“paired twins”) for the promotion participants MATCH “Twin” PhysiciansMatched On: • Consensus Specialty • Geography • Class Rx Volume • Product Rx Share • Product Details • Product Samples • Payment Type \\us0n47\dss\PASNET\Training\PASNet Training.ppt
Paired Analysis Paired • Analyzes Participant and Control physician activity relative to the promotion month. • Analyzes Rxs and Call data (Details and Samples) for a matched set of physicians. • Shifts months for each physician based on promotion month. • The promotion occurs in month 0. • Paired Analysis can be re-run on any existing match. • Each participant has a “control doctor” that is an average of multiple “twins” \\us0n47\dss\PASNET\Training\PASNet Training.ppt
Both Match & Paired Analysis Match & Paired • Match Job • Selects Controls (“paired twins”) for the promotion participants. • Paired Analysis • Analyzes Participant and Control physician activity (Rxs, Details, and Samples) relative to the promotion month. • If desired, the match and analysis criteria may be different • (e.g., match using Viagra Rx history but analyze Levitra) \\us0n47\dss\PASNET\Training\PASNet Training.ppt
New or Total Rxs, Selectable time period, Any Subgroup Product Rx Impact: Participants vs. Control “Twins” Excel Output \\us0n47\dss\PASNET\Training\PASNet Training.ppt
Unadjusted Impact (Participants vs. Control): New or Total Rxs, Selectable time period Excel Output \\us0n47\dss\PASNET\Training\PASNet Training.ppt
Dashboard Summary: Product Rxs, Class Rxs, Product Share, Details, Sample, Competitor Impact Excel Output Product Rxs GSK Product Details Class Rxs GSK Product Samples Product Share of Class Rxs Competitor Share Impact \\us0n47\dss\PASNET\Training\PASNet Training.ppt
Time Alignment PASNet • Participants are matched to controls and analyzed based on the months before and the months after the event. • In the example below, there are 10,000 participants between the months of January and April. Only 5,000 participants have 4 complete months of post-promotion data. • 4 Months of Post-Period Results will be available with the August data month. \\us0n47\dss\PASNET\Training\PASNet Training.ppt
Unpaired Analysis Unpaired • User loads the participant list and the control list. • Analyzes the 2 groups without direct “twin” comparisons. • The Control Group (1K docs) is re-used for all 4 Promotion Months. \\us0n47\dss\PASNET\Training\PASNet Training.ppt
Find CID Find CID • All physicians must have a CID get the prescription information from PRx • Find CID is used to identify prescriber CIDs based on PRx Profile data. • Converts IDs to CIDs using a cross reference file • ID Sources: DEA, AMA, UPIN, KWNP, ADA, AAPA, AOA, APMA, ACNM, AMX • Contains over 35 algorithms with different combinations of a physician’s PRx Profile: • PROFILE Data: Last Name, First Name, Address, City, State, Zip Code, and Phone Number • Eliminates duplicate CIDs and selects the earliest promotion date • Some prescribers may not be found • Find CID will not generate false positive matches because the process limits the PRx Profile universe to those prescribers with a unique combination of the variables used within selected algorithm • The only cause of “False Positive” matches is incorrect information for a particular prescriber \\us0n47\dss\PASNET\Training\PASNet Training.ppt
Issues with incomplete Participant Lists Find CID • Lack of CIDs is a problem. You need to figure out who those people without CIDs are. Thus, you need to send a sample back to the vendor or product manager and ask them to better identify these people. They could be office staff that can be linked to prescribers by their office address. For instance, if it is a program for office nurses, you can use PRx profile to get all CID from t he same addresses and use them in place of program attendees. Eventually, there are two ways to proceed, either do not measure the impact of the program or include them in the program cost. • 1) Include in program cost - If these attendees are PAs, nurses, office staff who are not prescribers, we calculate the RX impact on only the attendees with CIDs but keep the full cost of the program. In the ROI page, instead of applying the cost per attendee only for the attendees with CIDs, you should apply the full cost of the program. Non-prescribers still eat the dinner and listen to the speaker, so they cost us. However, they indirectly impact prescribing of physicians who brought them to the promotion. • 2) Do not measure the impact - if attendees can't be identified and linked to individual prescribers, we cannot measure their impact on Rx volume. If you have CIDs for less than 50%-60% of attendees, do not measure the impact. Most likely unidentified prescribers will show up in the matched control group and narrow the gap between the attendees and control baseline. Thus, resulting ROIs will be much lower or negative. • Ryan McClain and Jenny Carrington studied this problem last year. See pages 10-11 in the RyanM_PEPTRA_V2.ppt saved on T in Promo Impact\attendlists. \\us0n47\dss\PASNET\Training\PASNet Training.ppt
Features of the PASNet output Statistical Test of Significance Carryover Curves for additional promotion types And… “Behind the Scenes” demo
Promotion Analysis SystemTemplate for Excel Output Excel Output 2 3 • NEW Features: • Statistical confidence: 80%, 90%, or 95%. • “Remove Data” button to clear results for current Job ID. 1 • 3. Feature Reminder: • Changes to • “Name of Program” • “Product Group” • “Therapeutic Class” • will change Label and Title references throughout the PASNet output. \\us0n47\dss\PASNET\Training\PASNet Training.ppt
Adjusted Product Rx Impact:New or Total Rxs, Selectable time period Excel Output • NEW Feature: • Statistical Confidence (at 80%, 90%, or 95%) with Lower Limits and Upper Limits for: • Incremental Rxs • Percent Rx Change. 1 2 \\us0n47\dss\PASNET\Training\PASNet Training.ppt
Sub Group Analysis Excel Output • The output comes directly from SAS, and the time periods are hard-coded. • Pre-period uses months -4 to -1. • Post-period uses months +1 to +4. • Includes Statistical Test of Significance (p-value) • The two-tailed p-value, labeled Pr > |t| in the output, is a measure of the strength of the comparison between the 2 groups in the post period. The smaller the p-value, the stronger the evidence that the groups are different from each other. Product Decile Class Decile Specialty Group Sales Region Promotion Month \\us0n47\dss\PASNET\Training\PASNet Training.ppt
Adjustment Methodology for Control Group Adjusted Controls • Method to “Adjust” for differences between Test (Participants) and Control Twins in the Pre-Period • Goal: Adjust the Rxs for the Control group so the average monthly Rxs in every segment is the same for each group (Test and Control) in the Pre-Period. • “Ratio” Adjustment (or percent change) using the Pre-Period Ratio • For the “Pre-Period” calculate the ratio of Test to Control (or Test / Control). • Apply this ratio (T/C) to adjust the Control group for all monthly observations: Adjusted_Control = Control_Rxs * (Pre_Test / Pre_Control) • Approach: • The pre-period is months -4 to -1; the post-period is months +1 to +4 • Use Product New Rxs • Adjustment factors are calculated at the segment level (Product Decile, Market Decile, Specialty, Sales Region, Promotion month) • Adjustment factors are applied to monthly prescriber-level data in both the pre-period and the post-period • Modeling (the statistical test of means using PROC GLM) should be done on monthly prescriber-level data. \\us0n47\dss\PASNET\Training\PASNet Training.ppt
Adjustment Methodology for Control Group Adjusted Controls • “Ratio” Adjustment using the Pre-Period Ratio • For the “Pre-Period” calculate the ratio of Test to Control (or Test / Control). • Apply this ratio (T/C) to adjust the Control group for all monthly observations: Adjusted_Control = Control_Rxs * (Pre_Test / Pre_Control) Note: The “Ratio” adjustment is applied when the T/C Ratio in the Pre-Period is between 0.5 and 2.0. \\us0n47\dss\PASNET\Training\PASNet Training.ppt
Adjustment Methodology:the Participant Group has zero Rxs in the Pre-Period Adjusted Controls • If the Test group has zero Rxs in the Pre-Period, the adjustment ratio (T/C) would be zero. If applied, the Control Group Rxs would be “adjusted” to zero for all months (Pre and Post). • Adjustment Method: “None” • No adjustment should be made to the Control Group. • In other words, use the actual (observed) Rxs for the Control Group. \\us0n47\dss\PASNET\Training\PASNet Training.ppt
Adjustment Methodology:the Control Group has zero Rxs in the Pre-Period Adjusted Controls • If the Control group has zero Rxs in the Pre-Period, the adjustment ratio (T/C) cannot be calculated (division by zero). • Adjustment Method: “Diff” • An adjustment should still be made, but the adjustment should be based on the difference between the Test group and the Control group in the Pre-Period (i.e., Test minus Control) • In other words, add the difference in Rxs (Test minus Control) so the "Adjusted" Control group will have the same Pre-Period average as the Test group. Note: The “Diff” adjustment is applied when the Participants have Rxs in the Pre-period and the T/C Ratio is not between 0.5 and 2.0. \\us0n47\dss\PASNET\Training\PASNet Training.ppt
24-Month ROI CalculationBased on New Rxs or Total Rxs Excel Output # of months selected for the post-promotion period Note: Comments are included in the Excel output. # of participants in the selected subgroup \\us0n47\dss\PASNET\Training\PASNet Training.ppt
Impact on Competitor Share Excel Output • Share change is the difference from the Pre Period (-4 to -1) to the Post Period (+1 to +4). • Share Impact is the net Market Share change for the Participants relative to the Control Group. • The graph is linked to an Excel pivot table. • The output can be customized with Excel. • Group/Remove brands • Change time periods • The underlying data in the [analyze_ppprod] tab is available: • by Brand or by Brand / Form / Strength • by Time Period or by month • for New Rxs or Total Rxs \\us0n47\dss\PASNET\Training\PASNet Training.ppt
Customizing Competitive Share: Grouping Brands Excel Output 6 4 5 2-3 In this example, all 21 brands (the default) from the Anti-Migraine class were chosen. The result is a cluttered graph that includes many brands with very few Rxs. The graph (to the right) can be achieved by following the 6 steps outlined below. 1 • Select and Right-click the pivot table. Choose “Refresh Data”. • Ctrl-click the items under “subgroup” in the pivot table. • Right-click one item and choose “Group and Show Detail” | “Group”. • Remove “subgroup” from the table by dragging it to the top of the pivot table. • Select cell (labeled “Group1”) and type new name (e.g., “All Other”). • Click “Refresh Graph” button to update the graph. \\us0n47\dss\PASNET\Training\PASNet Training.ppt
Customizing Competitive Share: Showing Brand/Form/Strength Excel Output 5 2 3-4 1 6 In this example, 7 Brands of Triptans are shown. Instead, we want to see share impact by Brand/Form/Strength for only the tablet formulation. The graph (to the right) can be achieved by following the 6 steps outlined below. • Select and Right-click the pivot table. Choose “Refresh Data”. • Remove “subgroup” from the table by dragging it to the top of the pivot table. • Add “subsubgroup” to the table by dragging it down to the left side of the table. • Click the “subsubgroup” drop-down. • Choose all tablet formulations. • Click “Refresh Graph” button to update the graph. \\us0n47\dss\PASNET\Training\PASNet Training.ppt
Default Specialty Groupings Custom Grouping • GSK’s Customer Management System (CMS) maintains ~30 specialty groups • Each sub-specialty is assigned to exactly one of these specialty groups Current as of Dec-2004 \\us0n47\dss\PASNET\Training\PASNet Training.ppt
Create Custom Specialty group:Remove CHP from Psychiatry for PAXIL Custom Grouping PSYCHIATRY has 10 Subspecialties from CMS. Click to remove CHP specialty from the custom grouping. \\us0n47\dss\PASNET\Training\PASNet Training.ppt
Using “Paxil w/o CHP” custom specialty for analysis of Anti-Depressant market Custom Grouping Select the custom created Specialty from My Groupings \\us0n47\dss\PASNET\Training\PASNet Training.ppt
Loading a New Participant List Prescriber Lists 1 2 3 4 Steps 1-4 \\us0n47\dss\PASNET\Training\PASNet Training.ppt
Running a Find CID Job for a Participant List Prescriber Lists The first 3 (manually chosen) algorithms found 309 of 320 participants from this list. \\us0n47\dss\PASNET\Training\PASNet Training.ppt
Creating a Custom Product Share:Imitrex Tablets (from the Triptan Tablets Class) Parameters \\us0n47\dss\PASNET\Training\PASNet Training.ppt
Creating Match Parameters using custom “My Groupings” for Imitrex Tablets Parameters \\us0n47\dss\PASNET\Training\PASNet Training.ppt
Both Match & Paired jobs are using the same Parameters Jobs \\us0n47\dss\PASNET\Training\PASNet Training.ppt
Controls are selected for each Participant based on Rxs, Details, and Samples in the months prior to participation (month 0) By default, all weight is assigned to the aggregates 6 month aggregates (-7 to -2) for Class Rxs and Product Share 11 month aggregates (-12 to -2) for Details and Samples Calculating trends takes considerably more time and system resources. If the Controls do not trend well with the Participants in the months prior to promotion, consider re-matching with TREND weights. MATCH Parameters: Aggregate/Trends MATCH My Groupings: Aggregate/Trend Default Weights \\us0n47\dss\PASNET\Training\PASNet Training.ppt
MATCH: Requirements for Selection MATCH • Participants and Controls must have at least one TRx in the last 24 months to be included in the Match (and Analyze) jobs. CID-level criteria: • Calculated using all markets for which PRx receives data, regardless of sales or macro market definitions. • Calculated using the pprx24 and morx24 files, the most recent 24 months of retail and mail order data. • NOTE: Mail Order is currently excluded from the impact measurement. • Source file: “/data/promon/stats/uniqcids.sas7bdat” NOTE: This filter is applied to both Participants and Controls in Match jobs, Analyze jobs, and Unpaired jobs. • Control docs must prescribe the PASNET custom defined market to be selected. • If trying to include doctors with no Rx history in the defined market (e.g., new product launch in a new therapeutic class), • It may be necessary to Match based on an expanded list of products. • Then Analyze based on the PASNET custom market definition. \\us0n47\dss\PASNET\Training\PASNet Training.ppt
MATCH:How are Controls selected? MATCH • Assign all CIDs to a segment based on specialty and 1st digit of zip code • Example segments: GP0-GP9, IM0-IM9, N0-N9 • Calculate the distance between each Test CID and all potential controls in the segment • Use the weights for Class Rxs, Product Share, Details, Samples, and Payment Type • Sort potential controls by Distance within each segment for each Test CID • Select the 5 (default) controls with the smallest distance from each CID • By SPECIALTY • Controls must come from the same PASNet Custom specialty group as the Participant • By ZIP CODE • Preference is given to the zip code match criteria (1, 2, 3, or 5 digits) • If a potential control does not meet the zip code match criteria, their weight is penalized so the search will be expanded to a 1-digit zip code • Controls must come from the same 1-digit zip code • If there are fewer than 5 Controls, only the controls within the specialty/zip segment will be selected \\us0n47\dss\PASNET\Training\PASNet Training.ppt