Download
1 / 52
520 likes | 700 Views
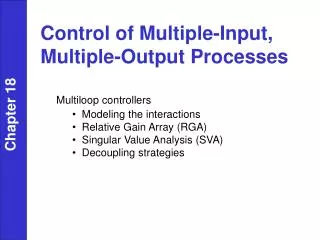
A Process Control Screen for Multiple Stream Processes. An Operator Friendly Approach. Richard E. Clark Process & Product Analysis. Injection Molding Extrusion Blow Molding Reheat Stretch Blow Molding Thermoforming Multilayer Sheet Extrusion. Double Seaming Filling Machines

E N D
A Process Control Screen for Multiple Stream Processes An Operator Friendly Approach Richard E. Clark Process & Product Analysis
Injection Molding Extrusion Blow Molding Reheat Stretch Blow Molding Thermoforming Multilayer Sheet Extrusion Double Seaming Filling Machines Heat Sealing Machines Labelers Multiple Stream Processes
The Object of This Paper is to Describe a System of Charts to Be Used by Operators and/or Inspectors to Control Multiple Stream Processes.
The Operator Needs to Know • That the process is adjusted so that the average of the characteristic being monitored is equal to the targeted mean. • That the means and variation of the individual streams are being maintained within an acceptable range. • That the pattern of variation among streams is stable. • That the individual items from all stations are conforming to internal or customer specification limits.
Process Model Yijk = + Ti + Pj + k(ij) i = 1, 2, …, t j = 1, 2, …, p K = 1, 2, …, n represents the process mean. Ti is an independently and normally distributed random variable with mean 0 and variance t2 which represents the process variation with time. By definition, TI equals 0 for an in control process. Pj is a fixed value representing the effect of station j. In order for the process average to = , the sum of the Pj over the j stations must be 0.
Process Model (cont.) k(ij) is an independently and normally distributed random variable with mean 0 and variance 2 resulting from random variation in the process and measurement system. For this paper, 2 is assumed to be constant for all positions and times.
Station Value 1 Yi11 = + 0 + P1 + 1(I,1) 2 Yi21 = + 0 + P2 + 1(I,2) 3 Yi31 = + 0 + P3 + 1(I,3) 4 Yi41 = + 0 + P4 + 1(I,4) 5 Yi51 = + 0 + P5 + 1(I,5) Observations from an “In Control” 5 Station Machine are Shown in the Table Below
Average Computation The average value for time i is calculated using the following equation. _ Yi.. = (5* + P1 + P2 + P3 + P4 + P5 + 1(I,1) + 1(I,2) + 1(I,3) + 1(I,4) + 1(I,5))/5 By definition P1 + P2 + P3 + P4 + P5 = 0 and the expected values for 1(i,j)’s is 0. Therefore; _ Yi.. = And is an unbiased estimate of the population mean.
Confidence Intervals The random component in each observation, k(ij), is independent of other observations and randomly distributed with mean 0 and variance 2 . _ Therefore, the confidence intervals for the means and observations from this process at time i are as follows. The mean at time i _ Yi.. ± 3*/√5 The mean for each position is: _ Y.j. = + Pj
Confidence Intervals (cont.) And the confidence intervals for control limits for the measurements from each position for an “in control” process are: _ YK(ij) = Y.j. ± 3*
Note: Sample 42 – All Values above mean with two by more Than 2 std. Dev.
Parameters Required to Calculate Control Limits for the Proposed Charts • Within Station Standard Deviation Inherent in the Process • Position Allowance for Maximum Position • Position Allowance for Minimum Position
Estimation of Within Position Inherent Standard Deviation • Estimate from Within Position Moving Range Data • Estimate from Analysis of Variance Residual after Removing Effects of Time and Position • Estimate from Analysis of Sample Means • Compare to Historical Data
Estimates of Standard Deviation Based on Within Positon Moving Range
Since Time is not significant, the SS for Time and Error can be pooled to improve the estimate of s.
Estimate of Standard Deviation Based on Analysis of Sample Averages
Estimation of Position Effects PMax & PMin • Historical Position Averages when Process is Stable • Analysis of Variance – Position Means • Engineering Judgment of Reasonable Ranges
Average for All Stations Increased by 1 for the Last 10 Points
Evaluation of Screen Change • Robust Container • Relatively Low Production Rate • Stable Process with Minimal Problems • Before ~ 3300 Observation • After 1 Year ~ 3300 Observations
Comparison of Probability Distributions Section B Before and After
Conclusion • Process control has improved substantially since the new screen was introduced on this line. • Since there is no control, it is not possible to determine how much if any of the improvement was due to the change. • “Hawthorne” Effect