Download
1 / 46
460 likes | 615 Views
Malaria Modeling for Thailand & Korea. — NASA Techniques and Call for Validation Partners. Richard Kiang NASA Goddard Space Flight Center Greenbelt, MD 20771. Acknowledgement. AFRIMS Dr. Jame Jones WRAIR Dr. Russell Coleman Dr. R. Sithiprasasna Dr. Gabriella Zollner

E N D
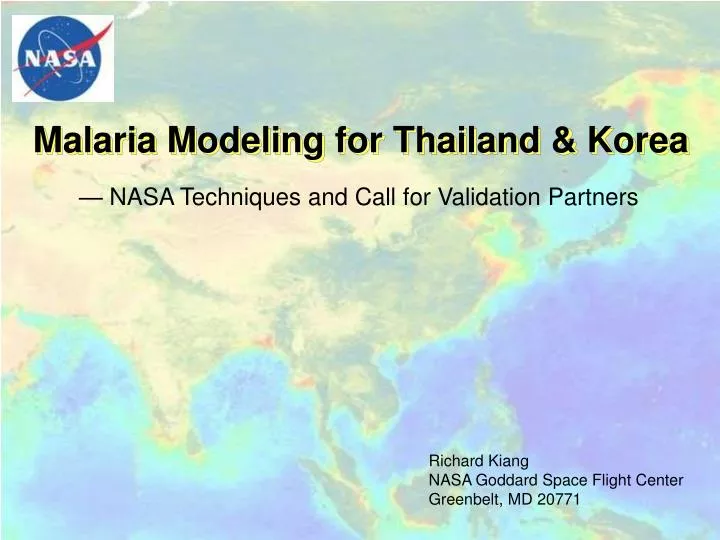
Malaria Modeling for Thailand & Korea — NASA Techniques and Call for Validation Partners Richard Kiang NASA Goddard Space Flight Center Greenbelt, MD 20771
Acknowledgement AFRIMS Dr. Jame Jones WRAIR Dr. Russell Coleman Dr. R. Sithiprasasna Dr. Gabriella Zollner USU Dr. Donald Roberts NDVECC Dr. David Claborn Dr. Richard Andre Dr. Leon Robert Ms. Penny Masuoka NGA Mr. John Doty DOS Mr. Andrew Herrup UC Davis Dr. John Edman Cornell Univ. Dr. Laura Harrington Mahidol Univ. Dr. S. Looareesuwan Thai MOPH Dr. J. Sirichaisinthop Dr. P. Singhasivanon Mr. S. Nutsathapana Dr. S. Leemingsawat Dr. C. Apiwathnasorn RTSD Gen. Ronnachai Thai Army Lt. P. Samipagdi Dr. Kanok
Test Sites Test Sites Tak Ban Kong Mong Tha Kanchanaburi Ratchaburi Narathiwat Mekong Malaria & Filariasis Kanchanaburi Malaria Cases Ikonos Source: SEATMJ Ban Kong Mong Tha Field work / Mahidol Field work / AFRIMS Filariasis poster Richard.Kiang@nasa.gov
VALUE & BENEFITS • Increased warning time • Optimized utilization of pesticide and chemoprophylaxis • Reduced likelihood of pesticide and drug resistance • Reduced damage to environment • Reduced morbidity and mortality for US overseas forces and local population • DECISION SUPPORT • Vector Habitat Identification: • Determine when and where to apply larvicide and insecticide • Identification of Key Factors that Sustain or Intensify Transmission: • Determine how to curtail ongoing transmission cost effectively • Risk Prediction: • Predict when and where transmission may occur and how intense it may be Mekong Malaria and Filariasis • MODELS • Vector Habitat Model • Malaria Transmission Model • Risk Prediction Model • temperature • precipitation • humidity • surface water • - wind speed & direction • land cover • vegetation type • transportation network • - population density Data • MEASUREMENTS • Ikonos • ASTER • Landsat • MODIS • etc. Richard.Kiang@nasa.gov
HABITAT IDENTIFICATION V & V RISK ASSESSMENT TRANSMISSION PREDICTION SURVEILLANCE V & V • Vector Control • Personnel Protection CONTROL RISK PREDICTION V & V MONITORING INTEGRATED PEST MANAGEMENT FOR DOD PROJECT OBJECTIVES
Satellite & meteor. data Microepidemiology data Local environment Population database Landcover Dwelling Host behaviors Vector control Vector ecology Medical care Primary schizogony Sporozoites Hypnozoites relapses Asexual erythrocytic cycle Oocysts VECTOR HUMAN Fertilization Gametocytes PARASITE • blood meal • oviposition • eggs • larvae • pupae • adults • destroyed • pre-patent • incubation • delay • treatment • infectious • relapse • immunity Mode 1 Mode 2 Mode 3 Spatio-temporal distribution of disease cases Identifying key factors that sustain or intensify transmission Habitat identification Objectives, Approaches & Preliminary Results Risk prediction Textural-contextual classificationssignificantly increase landcover mapping accuracy using high resolution data such as Ikonos. Nonparametric modelcomputes the likelihood of disease outbreak using meteorological and epidemiological time series as input. Discrete Wavelet Transformis used to differentiate confusion vegetation types. Wavelet TransformandHilbert-Huang Transform Empirical Mode Decompositionidentify the driving variables that lead to disease outbreaks and provide more accurate predictions. Evaluated Thail militaryairborne dataand established neural network rectificationcapability. Richard.Kiang@nasa.gov
Bamboo Cups Kanchanaburi
Washington, D.C. Space Imaging’s Ikonos imagery
Steps in Performing Discrete Wavelet Transform approx down sample cols down sample rows low pass on rows low pass on cols vertical edges image high pass on rows high pass on cols horizontal edges diagonal edges
Textural Feature Extraction using Discrete Wavelet Transform Approx H Horizontal Edges A square neighborhood in the imagery data V n-D entropy vector D Diagonal Edges Vertical Edges
Class Separability with Textural Features extracted by Discrete Wavelet Transform
Entropy Derived from DWT as Textural Measure to Aid Classification Ikonos Last 8x8 neighborhood Its WC from DWT Combined with panchromatic Largest entropy 2nd largest entropy 1m resolution
Camp Greaves and Surrounding AreaKyunggi, South Korea kr4_truecolor_brightened.jpg Space Imaging’s Ikonos imagery
Pseudo Ground Truth Kr34_pseudogt.jpg
Panchromatic Intensity (R+G+B)/3 (N+R+B)/3 Space Imaging’s Ikonos imagery
From Cook et al. “Ikonos Technical Performance Assessment” 2001 SPIE Proceedings, Algorithms for Multispectral, Hyperspectral, ..., p.94.
Classification Accuracy using Pan-Sharpened Ikonos Data ( 1 meter resolution)
Detection of Ditches using 1-meter Data(Larval Habitats of An. sinensis)
NDVI from AVHRR Measurements NDVI = Normalized Difference Vegetation Index AVHRR = Advanced Very High Resolution Radiometer • NDVI = (near infrared – red) • ÷ (near infrared + red) • Can be used to infer ground cover • and rainfall. • Can be derived from other sensors as well. Compiled by NOAA/NESDIS for Feb. 13, 2001
Sample Image of Royal Thai Survey Department’s Airborne Instrument From a Beechcraft B200 Super King Air Effective surface resolution approx. 1.5m
Using Neural Networkto Rectify AircraftMeasurements Simulated Measurements Generated by Scanner Model Rectified open squares = real positions shaded squares = fitted positions
Ban Kong Mong Tha Sanghlaburi, Kanchanaburi, Thailand
An. dirus An. minimus
Primary Schizogony Sporozoites Hypnozoites Relapses Asexual Erythro. Cycle Oocysts VECTOR HUMAN Fertilization Gametocytes PARASITE • blood meal • oviposition • eggs • larvae • pupae • adults • destroyed • pre-patent • incubation • delay • treatment • infectious • relapse • immunity Spatio-Temporal Distribution of Disease Cases TRANSMISSION MODEL Microepidemiology Data Satellite & Meteor. Data Landcover Local Environment Vector Ecology Population Database Vector Control Host Behaviors Dwelling Medical Care
hx, hy, hproof rsex, rage, rimmune, revout, rgamet bx, by tegg, tlarva, tpupa, tmate, tovi, tspor wbtoh, whtoh, whtob mage, mspor tincub, twait, tgamet, theal, tpost, trelapse
2-Year Prediction of Malaria Cases Based on Environmental Parameters (temperature, precipitation, humidity, vegetation index) Tak, Thailand
Sources: CDC DVBID Rutgers Univ. Entomology Dept./NJMCA
Proteus Helios Altair Airborne Remote Sensing In late 19th Century … ER-2 Fleet
Neural Network Classification of GER 63-channel Scanner Data
1985-1999 SIESIP ½°×½° temp, precip 2000-2003 SIESIP ½°×½° temp, precip 1985-2003 NCEP 2½°×2½° rel. humidity 1998-2003 TRMM ½°×½° precip 1999-2003 MODIS 5×5 km² surface temp, lifted index, moist., etc. 1985-2000 AVHRR PF 8×8 km² NDVI 1999-2003 MODIS 8×8 km² NDVI
Time-Frequency Decompositions Dengue Cases – Kuala Lumpur Fourier Transform Hilbert-Huang Transform Wavelet Transform
RISK PREDICTION MODEL Nonparametric modelcomputes the likelihood of disease outbreak using meteorological and epidemiological time series as input. Wavelet TransformandHilbert-Huang Transform Empirical Mode Decompositionidentify the driving variables that lead to disease outbreaks and provide more accurate predictions.
NASA Goddard Space Flight Center Space Imaging’s Ikonos imagery Landsat-1 MSS
NASA/GSFC – Close-Up Pan: 1m MS: 4m Space Imaging’s Ikonos imagery
2-Year Prediction of Malaria Cases Based on Environmental Parameters (temperature, precipitation, humidity, vegetation index) Ratchaburi, Thailand
Ban Kong Mong Tha Sanghlaburi, Kanchanaburi, Thailand