Download
1 / 13
130 likes | 272 Views
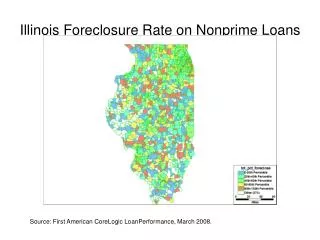
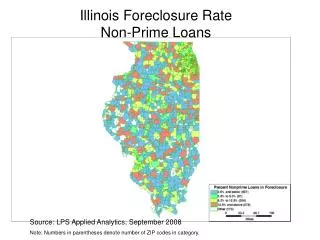
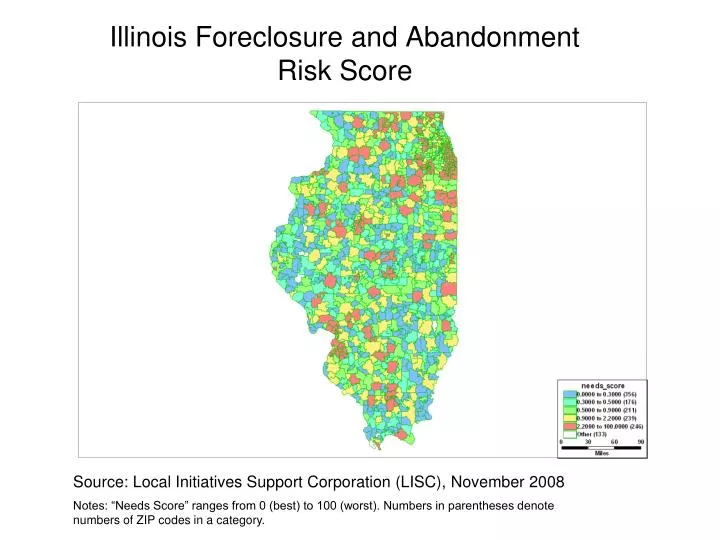
Illinois Foreclosure and Abandonment Risk Score. Source: Local Initiatives Support Corporation (LISC), November 2008 Notes: “Needs Score” ranges from 0 (best) to 100 (worst). Numbers in parentheses denote numbers of ZIP codes in a category. Chicago Area Foreclosure and Abandonment Risk Score.

E N D
Illinois Foreclosure and Abandonment Risk Score Source: Local Initiatives Support Corporation (LISC), November 2008 Notes: “Needs Score” ranges from 0 (best) to 100 (worst). Numbers in parentheses denote numbers of ZIP codes in a category.
Chicago Area Foreclosure and Abandonment Risk Score Source: Local Initiatives Support Corporation, November 2008 Notes: “Needs Score” ranges from 0 (best) to 100 (worst). Numbers in parentheses denote numbers of ZIP codes in a category.
Mid-Illinois Foreclosure and Abandonment Risk Score Source: Local Initiatives Support Corporation, November 2008 Notes: “Needs Score” ranges from 0 (best) to 100 (worst). Numbers in parentheses denote numbers of ZIP codes in a category.
Michigan Foreclosure and Abandonment Risk Score Source: Local Initiatives Support Corporation, November 2008 Notes: “Needs Score” ranges from 0 (best) to 100 (worst).Numbers in parentheses denote numbers of ZIP codes in a category. .
Southern Michigan Foreclosure and Abandonment Risk Score Source: Local Initiatives Support Corporation, November 2008 Notes: “Needs Score” ranges from 0 (best) to 100 (worst). Numbers in parentheses denote numbers of ZIP codes in a category.
Indiana Foreclosure and Abandonment Risk Score Source: Local Initiatives Support Corporation, November 2008 Notes: “Needs Score” ranges from 0 (best) to 100 (worst). Numbers in parentheses denote numbers of ZIP codes in a category.
Northern Indiana Foreclosure and Abandonment Risk Score Source: Local Initiatives Support Corporation, November 2008 Notes: “Needs Score” ranges from 0 (best) to 100 (worst). Numbers in parentheses denote numbers of ZIP codes in a category.
Indianapolis Area Foreclosure and Abandonment Risk Score Source: Local Initiatives Support Corporation, November 2008 Notes: “Needs Score” ranges from 0 (best) to 100 (worst). Numbers in parentheses denote numbers of ZIP codes in a category.
Wisconsin Foreclosure and Abandonment Risk Score Source: Local Initiatives Support Corporation, November 2008 Notes: “Needs Score” ranges from 0 (best) to 100 (worst). Numbers in parentheses denote numbers of ZIP codes in a category.
Southern Wisconsin Foreclosure and Abandonment Risk Score Source: Local Initiatives Support Corporation, November 2008 Notes: “Needs Score” ranges from 0 (best) to 100 (worst). Numbers in parentheses denote numbers of ZIP codes in a category.
Mid-Wisconsin Foreclosure and Abandonment Risk Score Source: Local Initiatives Support Corporation, November 2008 Notes: “Needs Score” ranges from 0 (best) to 100 (worst). Numbers in parentheses denote numbers of ZIP codes in a category.
Iowa Foreclosure and Abandonment Risk Score Source: Local Initiatives Support Corporation, November 2008 Notes: “Needs Score” ranges from 0 (best) to 100 (worst). Numbers in parentheses denote numbers of ZIP codes in a category.
Iowa Select Cities Foreclosure and Abandonment Risk Score Source: Local Initiatives Support Corporation, November 2008 “Needs Score” ranges from 0 (best) to 100 (worst). Numbers in parentheses denote numbers of ZIP codes in a category.