Download
1 / 24
240 likes | 357 Views
Phosphorus Fertilizer Needs in North America. 18 th Annual Regional Phosphate Conference, Lakeland, Florida October 16, 2003 Paul Fixen Potash & Phosphate Institute. Slide set available at http://www.ppi-ppic.org/ppiweb/napro.nsf. Take away messages about phosphorus in North America.

E N D
Phosphorus Fertilizer Needs in North America 18th Annual Regional Phosphate Conference, Lakeland, Florida October 16, 2003 Paul Fixen Potash & Phosphate Institute Slide set available at http://www.ppi-ppic.org/ppiweb/napro.nsf
Take away messages about phosphorus in North America • Phosphorus removed from U.S. farmlands by today’s crops exceeds use by 30% if manure P is ignored due to its localized use. • Counting all recoverable manure P as agronomically useful, results in a barely balanced budget, giving no opportunity to improve soil fertility or meet needs of the higher yielding crops of the future. • Nearly one out of every two soils sampled today indicates a need for a balanced or surplus P budget to produce to full potential. • An increase in P usemust occur on many fields for farming systems to be sustainable … based on simple arithmetic. • The fertilizer industry has several excellent new programs in place to increase awareness of P shortages. Solid science-based evidence indicates an increasing role for fertilizer P in North American agriculture
N P2O5 K2O Consumption of N, P2O5, and K2O in the U.S. Current P consumption is similar to the late 1960s
Other crops 17.6% Sorghum, 2.5% Potatoes, 2.5% Corn grain 38.4% Cotton, 3.6% Corn silage, 3.7% Alfalfa 7.5% Wheat 16.5% Soybeans 7.7% U.S. phosphate fertilizer consumption by crop in 2001 Total P2O5 consumption 4.3 million short tons USDA-ERS, USDA-NASS, AAPFCO, PPI
Fertilizer use on corn in the U.S. N K2O P2O5 Current P rates on corn are similar to the late 1960s Data source: USDA-ERS Chemical Use Survey
Crop yield trends in the U.S. and Canada Since the late 1960s in the U.S. Corn During this time period P fertilizer use was flat or decreasing while P removal by higher yielding crops was markedly increasing. Corn yields have increased 75% Wheat Wheat yields have increased 40%
Will the back end of a cow and nutrient management planning put you out of business? Need to put manure P in perspective
Manure P in the U.S. in 1997 according to NRCS relative to fertilizer P Million lb P2O5 Manure data source: Kellogg et al., 2000
Partial P budgets for the U.S. and selected states (average of 1998-2000) 1 Potash & Phosphate Institute (0.35 lb P2O5/bu corn for IA). 2 Terry and Kirby, 2000, 2001. 3 Kellog et al., 2000 (1997 production).
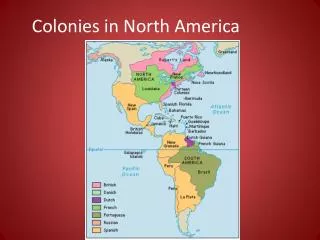
BC AB MB SK ON PQ PEI WA NB ME MT ND NS MN OR VT R/F ID NH NY WI 0.00-0.49 SD MI MA 0.50-0.89 CT WY RI IA 0.90-1.09 PA NE OH NJ NV IL IN 1.10-1.49 MD UT DE WV >1.50 CO VA MO CA KS KY NC TN OK AZ NM AR SC MS AL GA TX LA FL Ratio of P removal by crops to fertilizer applied.
BC AB MB SK ON PQ PEI WA NB ME MT ND R/(F+M) NS MN OR VT 0.00-0.49 ID NH NY WI 0.50-0.89 SD MI MA 0.90-1.09 CT WY RI IA 1.10-1.49 PA NE OH NJ NV IL IN >1.50 MD UT DE WV CO VA MO CA KS KY NC TN OK AZ NM AR SC MS AL GA TX LA FL Ratio of P removal by crops to fertilizer applied plus recoverable manure.
Two decades of building soil P One decade of mining An Acre of Corn, 1970 to 2000
Average P use on corn and soybeans relative to crop removal Gap is growing Use Removal
What are the consequences of negative P budgets in crop production? It depends on the existing soil test level
Soil Test Level vs. Relative Yield 100 Relative yield (%) Mining reduces yield, quality, & land value Mining has no effect (land value?) Critical range Soil test level
An extreme case An extreme case
How does soil test P change with a negative budget? An insidious decline resulting in gradual erosion of potential 50 45 40 35 298 lb P2O5 in 1975 30 Bray P1 (ppm) 25 20 15 10 0 lb P2O5 in 1975 5 0 1976 1978 1980 1981 1983 1985 1987 1975 1977 1979 1982 1984 1986 1988 1989 Year Webb et al., 1992 (Iowa)
Percent of Soils Testing Medium or Lower in P in 2001 (at or below critical) BC AB MB 37 SK 59 86 ON PQ 73 PEI 26 40 WA NB 50 28 ME 45 78 MT ND 78 NS 25 21 MN OR VT 41 47 ID NH NY 70 58 52 69 38 WI SD 24 MI MA 25 CT WY RI 36 16 39 IA 59 PA NE OH NJ NV 25 53 IL IN 58 42 MD 45 15 UT DE 59 WV CO VA MO 34 60 46 47 CA 69 KS 47 KY 31 18 60 22 NC TN OK AZ NM 68 AR 46 SC 62 37 57 MS AL GA 79 61 60 Based on 2.5 million soil samples TX LA 58 59 North America 47% FL 51
AB SK MB SD ND NE KS OK IA IL IN MN NE OH Percent of Soil Samples Testing Medium or below in P in the Great Plains and Corn Belt For the six leading corn producing states, survey trends suggest that soils have been slipping from high back into medium since about 1990.
Nearly one out of every two soil samples today indicates a need for a balanced or surplus P budget to produce to full potential… and strong evidence indicates its not happening.
What is PPI/FAR doing to make it happen? • Coordinate university-based research to develop strong P recommendations • KSU P Fellowship Center of Excellence Program • Funded directly by Agrium,Cargill,IMC,PCS,Simplot • Conduct soil test summaries – 2001, 2005 • Published: Plant Nutrient Use in North American Agriculture – source of much of today’s data • Educational materials on P, soil testing, & budgets • P nutrition PPT series (slides, speaker notes, references) • Site-specific precision ag materials … low P areas within fields • PKalc: user friendly nutrient budget software … takes it to the farm • Numerous other items: www.ppi-ppic.org • Work with NRCS and other agencies on P policy and water quality issues – part of solution not part of problem • Provide technical support directly to our members
P-specific campaign with public and private sector partners to educate crop advisers, farmers and the ag media (launched in September, 2003). Directed at crop advisers and farmers. Focused on the basics of soil testing and balanced nutrition. Multi-media program to educate the industry and arm them to communicate positive messages about P and other nutrients to their customers and communities. Examples of member programs
Take away messages about phosphorus in North America • Phosphorus removed from U.S. farmlands by today’s crops exceeds use by 30% if manure P is ignored due to its localized use. • Counting all recoverable manure P as agronomically useful, results in a barely balanced budget, giving no opportunity to improve soil fertility or meet needs of the higher yielding crops of the future. • Nearly one out of every two soils sampled today indicates a need for a balanced or surplus P budget to produce to full potential. • An increase in P usemust occur on many fields for farming systems to be sustainable … based on simple arithmetic. • The fertilizer industry has several excellent new programs in place to increase awareness of P shortages.
… and solid science-based evidence indicates it can have an increasing role in North American agriculture