Download
1 / 47
510 likes | 1.35k Views
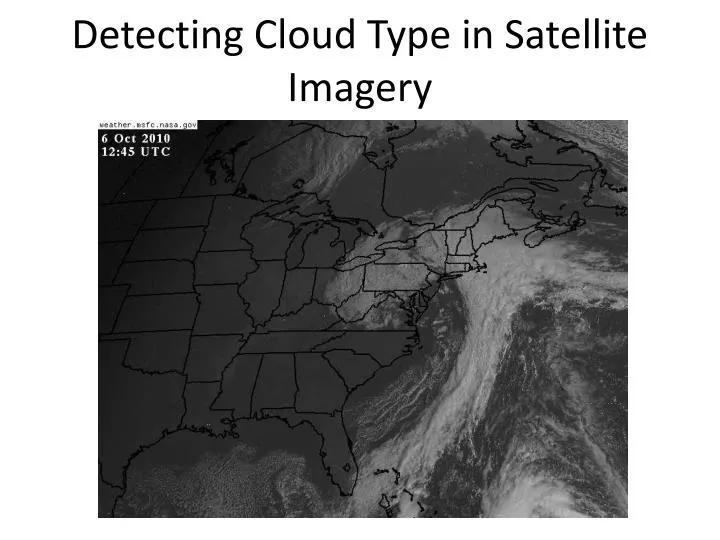
Detecting Cloud Type in Satellite Imagery. Cloud Formation. Clouds form when air is cooled to its dew point. For most clouds, the cooling process is upward vertical motion or lifting. Stable atmospheres slow, gentle, large scale rising air motion-- stratiform

E N D
Cloud Formation • Clouds form when air is cooled to its dew point. • For most clouds, the cooling process is upward vertical motion or lifting. • Stable atmospheresslow, gentle, large scale rising air motion--stratiform • Unstable atmospheresvigorous rising bubbles of air (thermals), strong, concentrated updrafts surrounded by larger cloud-free areas of sinking air--cumuliform • For fog, the cooling process can be radiational cooling or advection across a cold surface—stratiform—lifting not required, but cooling is.
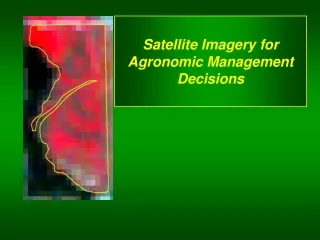
What allows us to distinguish features in satellite imagery? • Contrast between scenes (or pixels). • Contrast in visible due to: • Albedo differences • Contrast in IR due to: • Temperature differences
Features that aid in cloud identification • Brightness • Texture—due to shadows; only VIS • Smooth, lumpy, fibrous • Organizational pattern • Banded, linear, circular, cellular • Edge definition • Sharp • fuzzy • Size • Individual shape
Large scale patterns and terminology (see following slides): • Cloud shield • Cloud band • Cloud line • Cloud street • [Cloud finger—not really commonly used!] • Cloud element • Comma cloud
Cloud shield • Broad cloud pattern no more than four times as long in one direction as wide in the perpendicular direction.
Cloud Band • Nearly continuous cloud formation with a distinct long axis; the ratio of length to width is at least 4 to 1 and the width of the band is greater than 1 degree latitude.
Cloud Line • Narrow cloud band in which the individual cloud cells are connected and the line is less than 1 degree of latitude. • Cloud lines are indicative of low-level convergence. • Sometimes cloud lines are called “rope clouds,” especially when they are associated with the convergence along a surface cold front. • Rope clouds often evident over the ocean with weakening fronts.
Rope cloud animation fromhttp://cimss.ssec.wisc.edu/goes/blog/archives/555
More on Rope Clouds: • http://www.met.tamu.edu/class/wflm/tut/sat/sat8.html Copyright © 1996-2003 Texas A&M University,Texas A&M Atmospheric Sciences Department and Dr. John Nielsen-Gammon.
Cloud Street • A narrow cloud band of low-level convective clouds in which the individual cells are not connected. Several streets generally line up parallel to each other and along the low-level wind flow.
Cloud Element • The smallest individual cloud form that can be resolved in a satellite image.
Comma Cloud • A vortex that contains one or more spiral cloud bands that converge toward a common center; shaped like a “comma.”
Cloud Classification • Clouds classified according to: • Height—defined by altitude of cloud base. • High—cirrus (Ci), cirrostratus (Cs), cirrocumulus (Cc) • Middle—Altostratus (As), Altocumulus (Ac) • Low—Stratus (St), stratocumulus (Sc), nimbostratus (Ns) • Clouds with vertical development—cumulus (Cu), cumulus congestus (Towering Cumulus-TCU), cumulonimbus (Cb) • Form—determined by stability and altitude • Cirriform—high altitude, ice crystals • Stratiform—stable atmosphere, flat, layered, featureless • Cumuliform—unstable, vertical development, cast shadowstextured
Texture in Visible Satellite Imagery • Smooth textures—lack of shadows, so associated with flat featureless clouds stratiform. • Fibrous texture—wispy, can see through itcirrus, or the cirrus anvil of a cumulonimbus • “Lumpy” textures—associated with shadowing, which requires vertical developmentcumuliform clouds.
Edge Definition • Fuzzy edge definition: cirrus clouds downwind side of cirrus CB anvils equatorward side of jet stream cirrus band • Sharp edge definition: upwind side of CBs cloud boundaries limited by terrain—fog/stratus poleward side of jet stream cirrus will have an anticyclonically curving sharp edge,
Visible Images • Visible images show “reflected” sunlight • Shadows give texture • Shadows sometimes cast by higher clouds on lower clouds • Different types of clouds and terrain reflect sunlight differently • Note: must have sunlight! Cannot typically get visible images at night (moonlight images do exist)
Visible ImagesSurface Reflectivity • All surfaces reflect varying amounts of sunlight From Radar and Satellite Weather Interpretation for Pilots, Lankford.
Visible ImagesSurface Reflectivity • Brightness on a visible image directly related to reflectivity • Highly reflective surfaces appear bright white • Low reflectivity surfaces appear gray or black • Thunderstorms Bright white • Thin clouds Gray • Oceans Black
Visible Images • Small clouds and thin clouds may appear gray • Gaps between small clouds allow some of the Earth’s reflected energy through, when averaged with the clouds, the clouds appear grayer than normal • Thin clouds allow most of sun’s energy to pass through, reflecting very little sunlight, again appearing gray Surface
Visible Satellite Images • Legend indicates reflectivity • Thick, solid, dense clouds appear very bright Thick Thin Thick
Visible Satellite ImagesSunlight is required • Image taken near sunrise over mid-west • West Coast still dark • No sunlight, no image – Area is NOT cloud free!
Visible Satellite ImagesSunlight required • Same location 4-hrs later • Clearly, clouds did exist over west coast
Infrared Images • All objects with a temperature above absolute zero radiate energy • The wavelength of energy depends on the temperature of the object • Because of the Earth’s temperature, it radiates most of its energy at infrared wavelengths • Sensing infrared energy allows us to determine the temperature of the Earth and clouds. • Since infrared sensors detect temperature not reflected light, they can be used at night
IR useful for cloud heights. Temperature scale • Displays cloud or surface temperature can compare with tropospheric temps. to determine height • For black & white images: • Bright white very cold temperatures high clouds • Black very warm temperatures low clouds or surface
Infrared Satellite Images Temperature scale • Colors frequently used to help better visualize temperature ranges.
Infrared ImagesCloud Height • IR sensors detect temperature • Colder temperatures occur higher in the troposphere • Warmer temperatures occur near the Earth’s surface • IR images give an excellent indication of cloud height • Using IR data with a temperature sounding allows us to determine the exact height of clouds
Using IR to Estimate Cloud Height Step 1: Determine cloud top temperature -68°C
Using IR to Estimate Cloud Height Step 2: Use current temperature sounding to estimate height at which the temperature was observed. ~15 km -68°C 15km ~ 49,000 ft
Infrared ImagesEnhancement Curves • Color scales on IR images are often “enhanced” to clearly differentiate very cold cloud tops from surrounding cold cloud tops. • Helps identify areas of strong thunderstorms • Strong thunderstorms often penetrate the tropopause where temperatures are a minimum • Enhancing the color scale for cold temperatures makes the cold areas stand out
Infrared ImagesEnhancement Curves • Notice color scale to right of color image. • Only coldest temperatures are in color • Helps pinpoint areas with potential thunderstorms
Infrared ImagesProblems Detecting Fog • Disadvantage: Low clouds and fog are difficult to see since their temperatures are nearly the same as the temperature of the Earth’s surface • Fog especially troublesome • Usually forms at night when visible images not available • Temperatures very close to surface temperature so IR images can’t tell the difference
Infrared ImagesProblems Detecting Fog • Fog Example • Left: Early morning visible image over NM • Right: Same time/location but an IR image Visible IR
VIS image shows sharp edge of fog because of terrain. • Fog tends to follow the terrain • Elevated peaks clearly evident
Using VIS and IR Together • Best information is gained by using BOTH visible and IR images to determine cloud type • Cold clouds don’t always mean thunderstorms
Using VIS and IR Together IR VIS • Stratus (warm, thick) • Cb (cold, thick) Note: verified with radar • Low stratus, fog (warm, thick) • Cumulus (warm, thin) 1 1 2 2 3 3 4 4
Water Vapor Images • Water vapor images related to distribution of moisture at the top of the troposphere (near 30,000 ft). • Dry regions dark (or colored; frequently red). • White (or colored) clouds. • High clouds are shown, but not low clouds.
Sources of Satellite Images • Available from a large number of sites. • ERAU Satellite Imagery • ADDS – Satellite • Interactive Weather Satellite Imagery Viewers from NASA GHCC • SSEC - Geostationary Satellite Images • NRL Monterey Images with NOGAPS Overlays