Download
1 / 53
530 likes | 642 Views
From UPED to REMI: Utah’s Experience in Developing Long-Term Economic and Demographic Projections. Utah Governor’s Office of Planning and Budget January 2006. Synopsis of Current Situation. Utah bought its REMI Policy Insight models in 2002

E N D
From UPED to REMI:Utah’s Experience in Developing Long-Term Economic and Demographic Projections Utah Governor’s Office of Planning and Budget January 2006
Synopsis of Current Situation • Utah bought its REMI Policy Insight models in 2002 • The REMI models replaced Utah’s in-house models, which had been used for over 30 years • The 2005 Baseline long-term projection series is the first one to incorporate the REMI models
Background of UPED • UPED combines a cohort component and an economic base model • It produces projections of population, components of change, households, and employment by industry at the county and state level • UPED was developed and implemented as Utah’s official projection model in the 1970s • UPED produced extremely accurate population projections • 1970 projection of state population in 2000 within 8% of actual decennial Census count
Utah is in the Center of the Fastest Growing Area of the Country Percent Change in Population for States: 1990 to 2000 U.S. Rate = 13.2% NH 11.4 WA 21.1 ME 3.8 VT 8.2 MA 5.5 ND 0.5 MT 12.9 MN 12.4 OR 20.4 NY 5.5 RI 4.5 WI 9.6 SD 8.5 ID 28.5 MI 6.9 CT 3.6 WY 8.9 IA 5.4 PA 3.4 NE 8.4 OH 4.7 NJ 8.9 IN 9.7 IL 8.6 NV 66.3 WV 0.8 VA 14 UT 29.6 MO 9.3 CO 30.6 DE 17.6 KS 8.5 KY 9.7 CA 13.8 NC 21.4 TN 16.7 OK 9.7 AR 13.7 SC 15.1 MD 10.8 AZ 40.0 NM 20.1 GA 26.4 AL 10.1 MS 10.5 LA 5.9 TX 22.8 FL 23.5 AK 14.0 Percent Change HI 9.3 39.6 or more (More than Three Times the U.S. Rate) 26.4 to 39.5 (More than Twice the U.S. Rate) Source: U.S Census Bureau
Utah’s Fastest Growing Counties1990 - 2000 BOX ELDER CACHE RICH WEBER MORGAN DAVIS DAGGETT SUMMIT SALT LAKE TOOELE WASATCH UINTAH UTAH DUCHESNE JUAB 40.0% Increase or Greater CARBON Increase of 20.0% - 39.9% SANPETE MILLARD EMERY GRAND Increase of less than 20% SEVIER PIUTE BEAVER WAYNE IRON GARFIELD SAN JUAN WASHINGTON KANE Source: US Census Bureau
Utah is an Urban State Percent Urban Source: U.S. Census Bureau
BOX ELDER CACHE RICH WEBER MORGAN DAVIS DAGGETT SUMMIT SALT LAKE TOOELE WASATCH UINTAH UTAH DUCHESNE JUAB CARBON SANPETE MILLARD EMERY GRAND SEVIER PIUTE BEAVER WAYNE IRON GARFIELD SAN JUAN WASHINGTON KANE Utah’s Population Centers • These counties are home to 1,813,669 residents, or 76% of the state’s population. • Three out of every four people in Utah live along the Wasatch Front. Source: U.S. Census Bureau
Utah’s Population Centers BOX ELDER CACHE RICH WEBER MORGAN DAVIS DAGGETT SUMMIT SALT LAKE TOOELE WASATCH UINTAH UTAH DUCHESNE • These counties are home to 1,973,207 residents, or 83% of the state’s population. JUAB CARBON SANPETE MILLARD EMERY GRAND SEVIER PIUTE BEAVER WAYNE IRON GARFIELD SAN JUAN WASHINGTON KANE Source: U.S. Census Bureau
Utah’s Population Centers BOX ELDER CACHE RICH WEBER MORGAN DAVIS DAGGETT SUMMIT SALT LAKE TOOELE WASATCH UINTAH UTAH DUCHESNE • These counties are home to 2,169,373 residents, or 91% of the state’s population. JUAB CARBON SANPETE MILLARD EMERY GRAND SEVIER PIUTE BEAVER WAYNE IRON GARFIELD SAN JUAN WASHINGTON KANE Source: U.S. Census Bureau
1972 1982 1993 1997
Utah Has the Largest Households in the Nation Average U.S. Household Size: 2.59 Utah....................3.13 Hawaii................ 2.92 California............ 2.87 Alaska................. 2.74 Texas.................. 2.74 Maine.................. 2.39 A “household is a person or group of persons who live in a housing unit. These equal the count of occupied housing units in a census. Source: U.S. Census Bureau, 2000 Census
Advantages and Disadvantages of UPED Advantages Accuracy 8% in 1970 2% in 1980 0.2% in 1984 Acceptability Institutionalized Alternate Scenarios Disadvantages Lack of documentation Complexity Individualized
Advantages and Disadvantages of REMI Advantages REMI has been tested and documented The design and results are similar to UPED Cost savings Continued local control Customizable Disadvantages Data differences National vs state data Assumption differences Model “irregularities” Demographics is more of a byproduct
Key REMI Model Features • Structural model that captures all inter-industry linkages • Is calibrated and estimated using national and regional data • Is dynamic and predicts when results will occur • Economic cause & effect relationships explain results • Is the leading policy analysis model in the U.S.
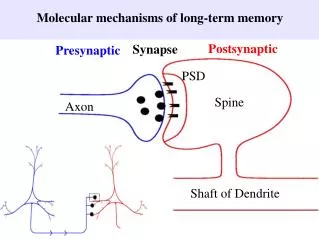
State of Utah Projections Process Economic Base Model Cohort Component Model Integrated Economic and Demographic Projections
REMI Model Structure Output Population & Labor Supply Market Shares Labor & Capital Demand Wages, Prices, & Profits
Growth Analysis • Population growth is a combination of migration and natural increase. • Employment drives migration. • National employment is projected based on U.S. Census Bureau population projections.
Components of Change • Migration contributed 22% of population increase from 1950 – 2004 • During the 1990s, migration rose to 36%. • Migration projected to be 26% from 2005 – 2035
The employment projection is based on a trend analysis of Utah’s historical share of national employment. Utah’s Share of National Employment
2005 Baseline Process • Begin with the state model • Incorporate employment using employment update • Incorporate fertility assumptions using policy variable selection • Disaggregate to the counties using the multi region county model • Testing and review to assure believability
Employment Growth by Decade for Utah and the U.S. Source: 2005 Baseline Projections, GOPB
SIC Major Industries in Utah: 1969 to 2035 Source: Provisional 2004 Baseline Projections, Governor’s Office of Planning and Budget
Utah Employment by Industry as a Share of Total State Employment Source: 2005 Baseline Projections, GOPB
A 100 Year Look at Utah’s Population Utah Population 1950 to 2050 Growth Sources: Historical, U.S. Census Bureau; Projected, 2005 Baseline Projections
State of Utah Components of Population Change Source: 2005 Baseline Projections, GOPB
Projected Median Age for Utah and the United States Source: 2005 Baseline Projections, GOPB
Utah’s Changing Age Structure 2000 2030 Male Female Source: Provisional 2004 Baseline Projections, Governor’s Office of Planning and Budget
Utah’s Changing Age Structure Female Male 2000 2050 Source: 2005 Baseline Projections, GOPB.
Growth of School-Age Population: 2000 to 2030 Source: 2005 Baseline Projections, GOPB.
Growth of 65 and Older Age Group: 2000 to 2030 Source: 2005 Baseline Projections, GOPB.
Age Group Growth Rate Comparison Source: 2005 Baseline Projections, GOPB.
Historical and Projected Dependency Ratios for Utah and the U.S. Source: 2005 Baseline Projections, GOPB.
Utah Dependency Ratios: 1990 to 2050 Source: 2005 Baseline Projections, GOPB.
U.S. Dependency Ratios: 1990 to 2050 Source: 2005 Baseline Projections, GOPB.
Population by Multi-County District: 1940 to 2030 Source: 2005 Baseline Projections, GOPB
Population Growth Rates by Multi-County District: 2000 to 2050 Source: Provisional 2004 Baseline Projections, Governor’s Office of Planning and Budget