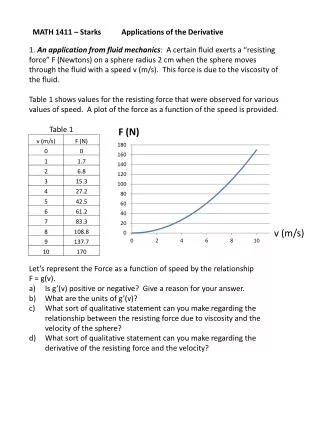
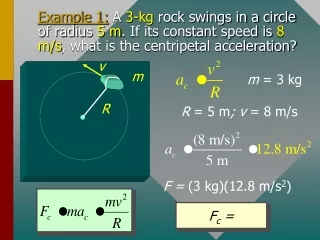
Download
1 / 14
140 likes | 149 Views
Application of an emissions source apportionment method for primary PM components in a regional air quality model. M. Samaali, M. Sassi, V. Bouchet

E N D
Application of an emissions source apportionment method for primary PM components in a regional air quality model M. Samaali, M. Sassi, V. Bouchet Environment Canada, Meteorological Service of Canada, Air Quality Modelling Application Section, 2121 Trans-Canada highway, Dorval, Québec, H9P 1J3. M. Moran Air Quality Research Division, Science and Technology Branch, Environment Canada, 4905 Dufferin Street, Toronto, ON, M3H 5T4, Canada.Environment 6-8th Oct. 2008, Chapel Hill, NC
Contents • Introduction • Implementation of a source apportionment (tagged species) method in AURAMS • Emissions inventory analysis • Modeling results (method’s verification and application) • Conclusion and future work
Introduction - How much does a given source contribute to total PM pollution? • Two main categories of source apportionment methods used in Eulerian 3D AQ model (Yarwood et al., 2004): • (1) sensitivity analysis methods • (2) tagged species methods. - American AQ models (e.g. CMAQ, CAMx) use already both techniques. - Canadian AQ models (e.g. AURAMS, CHRONOS) used only for scenarios analysis so far. Objective:implement, verify and apply a tagged species method in AURAMS to tag and track primary organic (POC) & elemental carbons (EC) emissions from 4 sources in the North American domain.
AQ model description (A Unified Regional Air quality Modeling System: AURAMS)
Implementation of a tagged species method in AURAMS • 4 source types (area and point): • on-road (vehicles, trucks, motorcycles), • off-road & others (marine, air, rail, residential, construction, agriculture, etc.), • minorpoints (stack height < 35m) • majorpoints (stack height >= 35m) • 2 tracers (i.e. POC and EC) for each source with 12 bins each: species increase from 108 to 204 PM species. • Apply the same physical and chemical processes treatment to the tagged species as the original POC and EC species: • Transport (3D advection) and vertical diffusion • Removal processes (dry deposition, wet deposition and rain, fog, and cloud processing) • Emissions (chemical speciation)
Emissions inventory analysis (1): POC and EC emissions totals (Jun-Jul-Aug 2002) Monthly total POC (PM2.5 ) emissions by source type Monthly total EC (PM2.5 ) emissions by source type On-road sources are major emitter of EC Off-road & other sources are major emitter of POC
Emissions inventory analysis (2) : POC from on-road and off-road & other sources (June 2002) Total POC (PM2.5 )from on-road Total POC (PM2.5 ) from off-road & other. - Most of the emissions are located in the Eastern domain - Canadian cities are surrounded by high emission levels
Emissions inventory analysis (3): POC from minor and major points (June 2002) Total POC (PM2.5 )emissionsfrom minor points Total POC (PM2.5 )emissionsfrom major points - Highest spatial density for minor points - Highest emission levels for major points
Runs settings and CPU time analysis Run period (J-J-A 2002) : started in May. 25th 2002, at 6:00 Lateral boundary (LB) & initial conditions: zero initial conditions & zero-gradient method for LB conditions Required computational resources on Environment Canada IBM cluster: ~ 62% CPU time increase Optimization of the code to keep CPU time increase at minimum
Modeling results (tagging method verification) (1) Average difference: 2.2 10-4 ug/m3 (0.37%) Average difference: 2.4 10-4 ug/m3 (1.48%) Good agreement between total POC and EC and their respective tracers sums
Modeling results (tagging method verification) (2) POC emissions contributions POC concentrations contributions There is a correspondence between concentration and emission contributions for each POC tagged species
Modeling results (tagging method verification) (3) EC concentrations contributions EC emissions contributions There is a correspondence between concentration and emission contributions for each EC tagged species
Modeling results (tagging method application) (4) Off-road & other. On-road 3% 5% 6% 2% 6% 3% 4% On-road POC concentration decrease: dispersion by wind & no significant surrounding emission sources. Off-road & other. POC concentration increase: balance with on-road & POC transport from surrounding sources.
Conclusion and future work • The tagged species method implemented in AURAMS verifies well the mass conservation and hypotheses (linearity) of primary chemistry processes. • The method’s application is promising for: • (1) Detailed analysis of pollution in Canadian cities • (2) Assessment studies of specific sources (e.g. transportation) - Code optimization is underway for possible future long-term (annual) runs.