Download
1 / 23
230 likes | 362 Views
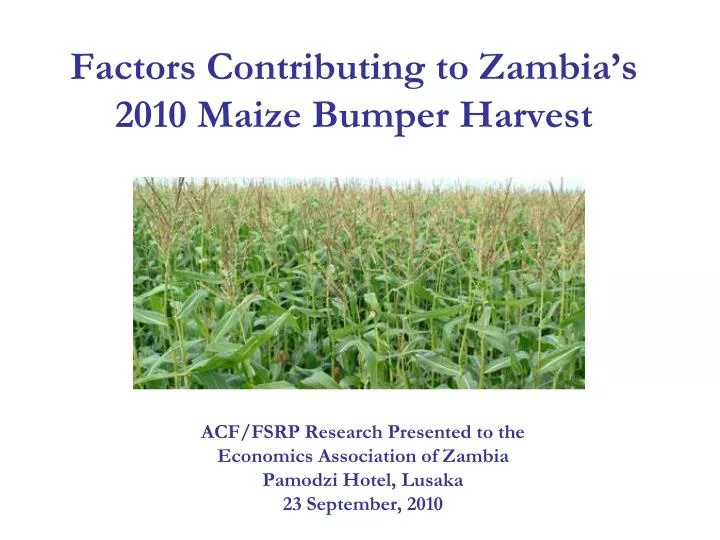
Factors Contributing to Zambia’s 2010 Maize Bumper Harvest. ACF/FSRP Research Presented to the Economics Association of Zambia Pamodzi Hotel, Lusaka 23 September, 2010. Introduction. Zambian maize production increased by roughly 48% from the 2009 to the 2010 harvests.

E N D
Factors Contributing to Zambia’s 2010 Maize Bumper Harvest ACF/FSRP Research Presented to the Economics Association of Zambia Pamodzi Hotel, Lusaka 23 September, 2010
Introduction • Zambian maize production increased by roughly 48% from the 2009 to the 2010 harvests. • Increases occurred in both the small-scale and commercial farm sectors
Objectives • Understand the key sources of maize production growth from 2009 to 2010 (yield, minimization of crop loss/abandonment and area expansion) • Determine which factors have driven changes in these sources and determine their relative importance (e.g. fertilizer, weather, seed use and others) . • What can Zambia learn from the 2009/10 bumper harvest.
Data • Data used comes from the 2005/06, 2006/07, 2007/08, 2008/09 and 2009/10 Crop Forecast Surveys • Collected annually by the Ministry of Agriculture and Cooperatives (MACO) in collaboration with the Central statistical Office
Contributions to Growth Δ Production = ΔYield + Δ Ratio of harvested to planted area + Δ Area planted Definitions prod=production y=yield ah=area harvested ap=area planted Δ=change Mathematically Based on the total derivative:
Contributions Within Each Province to Production Growth Source: Central Statistics Office Crop Forecast Survey 2008/09, 2009/10Note: Rows sum to 100
Number of maize growing households and total area planted by small/medium-scale Agricultural households , 2005/06-2009/10
Percent of maize area planted to be harvested, 2000/01-2009/10
National Maize Yield for small/medium-scale Agricultural households, 2005/06-2009/10
+34.6% +30.8% +33.3%
Post-estimation SimulationsChanges that drove yield increase
Yield Regression Analysis Yield increase from 2009 to 2010 was greater than 21% If only fertilizer (FISP and private sector) changes, increase is 6.7% If only weather changes, increase is 12.9% The majority of the increase in yield can be attributed to fertilizer and weather. Moderate increase in improved seed use also contributed.
2006 2007 2008 2009 Comparing the 2010 harvest to earlier years
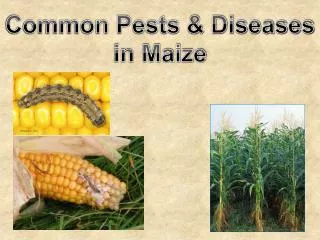
Conservation Farming • Highly effective • Not enough change in adoption to affect change in national production • CFS data not designed to sufficiently capture the relatively few households practicing CF on maize production. • Initial estimates indicate minimal contribution of CF to the growth in national production
ConclusionsThe difference in Zambian maize harvest from 2009 to 2010 (831,934 mt) can be attributed to:
What can we learn? Though Zambia had a good harvest in 2010, the country remains vulnerable to shifts in weather conditions. Under good conditions Zambia can produce a substantial surplus but without a stable maize marketing policy, the development of a vibrant local and export market will continue to be hampered.
What can we learn? When trading maize, marketing issues are international, so we can not make policies in a vacuum. We can not set the world price. If world price is below “cost of production,” is this an appropriate method for setting FRA prices and can we afford to use it? Don’t we risk subsidizing other countries who can cross the border to sell to FRA? So – how do we provide sustainable incentives to farmers to continue producing maize surpluses? 21
Acknowledgements • The authors are grateful for useful comments and assistance from many colleagues, including: • Dingi Banda, Michael Isimwaa, Nicolas Mwale, Derrick Sikombe, Nicole Mason, Margaret Beaver, Munguzwe Hichaambwa, Michael Weber, and Steve Longabaugh.