Download
1 / 14
150 likes | 240 Views
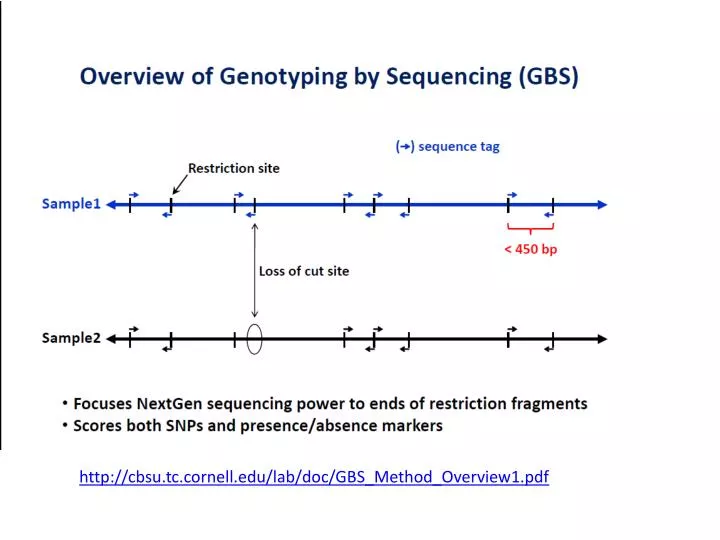
http://cbsu.tc.cornell.edu/lab/doc/GBS_Method_Overview1.pdf. RADseq : Restriction-site Associated DNA markers. Uses Illumina sequencing technology

E N D
RADseq: Restriction-site Associated DNA markers • Uses Illumina sequencing technology • Based on digestion with restriction enzymes. An adapter binds to the restriction site and up to 5kb fragments are sequenced around the target size. • Bioinformatics work used to find SNPs on the amplified regions
MORPHOLOGICAL RFLP SSR STS DArT SNP RAD
Marker Usefulness • Informativeness - measured by the number of alleles and allele frequencies • heterozygosity(H) • polymorphic information content (PIC) • Throughput - multiplex ratio (number of simultaneously assayed loci) • Utility • reproducibility of the marker assay • clarity of the marker genotypes
Heterozygosity orGene/Marker Diversity Outbred population • H estimates the probability that a randomly sampled individual is heterozygous Inbred population • H estimates the probability that a randomly sampled pair of lines are homozygous for different alleles pi is the frequency of the ith allele k is the No. of alleles (Nei 1973)
The Hardy-Weinberg Principle AA Aa Aa aa p1 (freq. of A) = 0.5 p2 (freq of a) = 0.5 p12 (freq. of AA) = 0.25 p22 (freq. of aa) = 0.25 2 p1 p2(freq. of Aa) = 0.50 p12 + 2 p1 p2 + p22 = 1.00 freq. of homozygotes = p12 + p22 freq. of heterozygotes = 1 - (p12 + p22)
Examples ABO alleles in humans If p1 = 0.28 , p2 = 0.06 , and p3 = 0.66 H = 1 – (0.282 + 0.062 + 0.662) = 0.48 SSR markers in sunflower If p1 = 0.13 , p2 = 0.19 , p3 = 0.62 , and p4 = 0.06 H = 1 – (0.132 + 0.192 + 0.622 + 0.062) = 0.56
Heterozygosity Heterozygosity for a genetic marker with k equally frequent alleles
Polymorphism Information Content (PIC) • A measure of the informativeness of a genetic marker for linkage analysis • Probability that a marker will be polymorphic in a set of untested genotypes pi is the frequency of the ith allele pjis the frequency of the jth allele k is the No. of alleles (Botstein et al. 1980)
H vs. PIC Heterozygocity and PIC for a genetic marker with k equally frequent alleles
Mean Heterozygosity Hj is the heterozygocity of the jth markers n is the No. of genetic markers
Mean Heterozygosity • HT mean heterozygocity for polymorphic and monomorphic markers • Hp mean heterozygocity for polymorphic markers Hj is the heterozygocity of the jth markers np is the No. of polymorphic markers nm is the No. of monomorphic markers When averaging over polymorphic and non-polymorphic markers
Mean number of polymorphic genetic markers per assay • Product of the mean number of bands per assay and mean heterozygocity ma is the No. of bands produced by ath assay b is the No. of assays m is the mean No. of bands per assay HTis the mean heterozygosity