Download
1 / 1
10 likes | 113 Views
www.biometeorology.umn.edu. biometeorology. Studying Carbon Cycle Processes in Agricultural Ecosystems of the Upper Midwest. T. Griffis 1 , J. Baker 1,2 J. Zhang 1 , B. Breiter 2 , T. Bavin 1 , I. Lawal 1 , R. Anderson 1 , M. Lennon 1

E N D
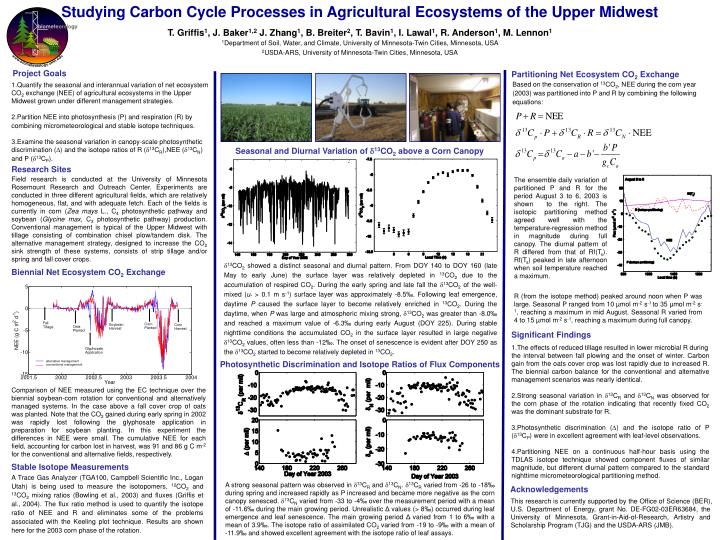
www.biometeorology.umn.edu biometeorology Studying Carbon Cycle Processes in Agricultural Ecosystems of the Upper Midwest T. Griffis1, J. Baker1,2 J. Zhang1, B. Breiter2, T. Bavin1, I. Lawal1, R. Anderson1, M. Lennon1 1Department of Soil, Water, and Climate, University of Minnesota-Twin Cities, Minnesota, USA 2USDA-ARS, University of Minnesota-Twin Cities, Minnesota, USA Project Goals Partitioning Net Ecosystem CO2 Exchange Based on the conservation of 13CO2, NEE during the corn year (2003) was partitioned into P and R by combining the following equations: 1.Quantify the seasonal and interannual variation of net ecosystem CO2 exchange (NEE) of agricultural ecosystems in the Upper Midwest grown under different management strategies. 2.Partition NEE into photosynthesis (P) and respiration (R) by combining micrometeorological and stable isotope techniques. 3.Examine the seasonal variation in canopy-scale photosynthetic discrimination (D) and the isotope ratios of R (d13CR),NEE (d13CN) and P (d13CP). Seasonal and Diurnal Variation of d13CO2 above a Corn Canopy Research Sites Field research is conducted at the University of Minnesota Rosemount Research and Outreach Center. Experiments are conducted in three different agricultural fields, which are relatively homogeneous, flat, and with adequate fetch. Each of the fields is currently in corn (Zea mays L., C4 photosynthetic pathway and soybean (Glycine max, C3 photosynthetic pathway) production. Conventional management is typical of the Upper Midwest with tillage consisting of combination chisel plow/tandem disk. The alternative management strategy, designed to increase the CO2 sink strength of these systems, consists of strip tillage and/or spring and fall cover crops. The ensemble daily variation of partitioned P and R for the period August 3 to 6, 2003 is shown to the right. The isotopic partitioning method agreed well with the temperature-regression method in magnitude during full canopy. The diurnal pattern of R differed from that of Rf(Ts). Rf(Ts) peaked in late afternoon when soil temperature reached a maximum. d13CO2 showed a distinct seasonal and diurnal pattern. From DOY 140 to DOY 160 (late May to early June) the surface layer was relatively depleted in 13CO2 due to the accumulation of respired CO2.During the early spring and late fall the d13CO2 of the well-mixed (u* > 0.1 m s-1) surface layer was approximately -8.5‰. Following leaf emergence, daytime P caused the surface layer to become relatively enriched in 13CO2. During the daytime, when P was large and atmospheric mixing strong, d13CO2 was greater than -8.0‰ and reached a maximum value of -6.3‰ during early August (DOY 225). During stable nighttime conditions the accumulated CO2 in the surface layer resulted in large negative d13CO2 values, often less than -12‰. The onset of senescence is evident after DOY 250 as the d13CO2 started to become relatively depleted in 13CO2. Biennial Net Ecosystem CO2 Exchange R (from the isotope method) peaked around noon when P was large. Seasonal P ranged from 10 µmol m-2 s-1 to 35 µmol m-2 s-1, reaching a maximum in mid August. Seasonal R varied from 4 to 15 µmol m-2 s-1, reaching a maximum during full canopy. Significant Findings 1.The effects of reduced tillage resulted in lower microbial R during the interval between fall plowing and the onset of winter. Carbon gain from the oats cover crop was lost rapidly due to increased R. The biennial carbon balance for the conventional and alternative management scenarios was nearly identical. 2.Strong seasonal variation in d13CR and d13CN was observed for the corn phase of the rotation indicating that recently fixed CO2 was the dominant substrate for R. 3.Photosynthetic discrimination (D) and the isotope ratio of P (d13CP) were in excellent agreement with leaf-level observations. 4.Partitioning NEE on a continuous half-hour basis using the TDLAS isotope technique showed component fluxes of similar magnitude, but different diurnal pattern compared to the standard nighttime micrometeorological partitioning method. Photosynthetic Discrimination and Isotope Ratios of Flux Components Comparison of NEE measured using the EC technique over the biennial soybean-corn rotation for conventional and alternatively managed systems. In the case above a fall cover crop of oats was planted. Note that the CO2 gained during early spring in 2002 was rapidly lost following the glyphosate application in preparation for soybean planting. In this experiment the differences in NEE were small. The cumulative NEE for each field, accounting for carbon lost in harvest, was 91 and 86 g C m-2 for the conventional and alternative fields, respectively. Stable Isotope Measurements A Trace Gas Analyzer(TGA100, Campbell Scientific Inc., Logan Utah) is being used to measure the isotopomers, 12CO2 and 13CO2 mixing ratios (Bowling et al., 2003) and fluxes (Griffis et al., 2004). The flux ratio method is used to quantify the isotope ratio of NEE and R and eliminates some of the problems associated with the Keeling plot technique. Results are shown here for the 2003 corn phase of the rotation. A strong seasonal pattern was observed in d13CR and d13CN. d13CR varied from -26 to -18‰ during spring and increased rapidly as P increased and became more negative as the corn canopy senesced. d13CN varied from -33 to -4‰ over the measurement period with a mean of -11.6‰ during the main growing period. Unrealistic Δ values (> 8‰) occurred during leaf emergence and leaf senescence. The main growing period Δ varied from 1 to 6‰ with a mean of 3.9‰. The isotope ratio of assimilated CO2 varied from -19 to -9‰ with a mean of -11.9‰ and showed excellent agreement with the isotope ratio of leaf assays. Acknowledgements This research is currently supported by the Office of Science (BER), U.S. Department of Energy, grant No. DE-FG02-03ER63684, the University of Minnesota, Grant-in-Aid-of-Research, Artistry and Scholarship Program (TJG) and the USDA-ARS (JMB).