Download
1 / 31
310 likes | 465 Views
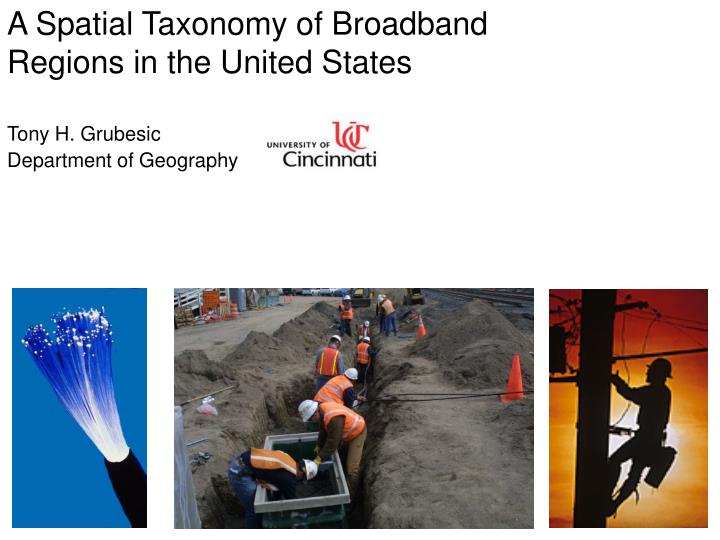
A Spatial Taxonomy of Broadband Regions in the United States. Tony H. Grubesic Department of Geography. Introduction. An interesting aspect of the Internet “bandwidth boom” in the United States during the late 1990s was the uneven nature of its spatial distribution .

E N D
A Spatial Taxonomy of Broadband Regions in the United States Tony H. Grubesic Department of Geography
Introduction • An interesting aspect of the Internet “bandwidth boom” in the United States during the late 1990s was the uneven nature of its spatial distribution. • Largest urban centers benefited from massive infrastructure upgrades • San Francisco, Washington, New York, Chicago, etc. • Major competitive advantage • Gradually – backbone infrastructure began to diffuse to 2nd and 3rd tier cities • Tampa, Portland, Omaha and Little Rock
Introduction • Uneven spatial distribution of infrastructure created concern: • Large segments of the population was not/could not participate in the emerging digital economy • (Parker, 2000; Strover, 2001; Korsching et al., 2000; Lentz and Oden, 2001; NTIA, 2000; NTIA and RUS, 2000) • Rural, remote and impoverished inner city locations • Residential access technologies continued to diffuse to the periphery • Primarily dial-up (Downes and Greenstein, 2002)
Introduction • Focus has shifted from dial-up to broadband • Reinvigorating the debate on access and equity • As new technologies emerge, isolated rural communities and disenfranchised urban neighborhoods will typically be at least one generation behind that of urban and growing rural communities (Johnson, 2001). • Is broadband diffusion following the “S” curve of innovation adoption? • What happens when the gap grows too large? • While many (if not most) rural areas have access, there are still questions of choice, competition, price and quality of service
Introduction • Elements of competition, policy, demographic and socioeconomic composition and location are creating distinctive broadband regions in the United States. • While some of these regions benefit from a robust choice of providers and access platforms, others are experiencing extremely limited access options. • More importantly, it is possible that “islands” of relatively strong broadband access exist in regions where the majority of communities have few options, and vice versa.
Purpose • Explore the diverse landscape of broadband access develops a spatial taxonomy of broadband regions for the United States in 2004. • By delineating these regions, we can begin to understand the spatial dynamics of advanced infrastructure availability • Spillover to suburban, exurban, rural and remote communities • Stronger linkages between broadband availability and the socioeconomic and demographic characteristics of these areas can be made • Deepen our understanding of how federal, state and local policies can both motivate and deter the rollout of advanced services
Policy and Regulation • Telecommunications Act of 1996 • Deregulated the industry • Section 706 directed the FCC and the fifty U.S. states to encourage the deployment of advanced telecommunications capability to all residents of the United States in a reasonable and timely manner (200 Kbps). • Problems with anticompetitive behavior, cream-skimming, low density markets • Both rural and urban markets suffered • Recent FCC report (2004) • 73% of the lowest pop. density zip codes have broadband • A 2x increase from 2001
Policy Choice and Competition • In the broadband marketplace, consumer choice is emerging as a fundamentally important issue • Platform: xDSL (15%), Cable (83%), Wireless, BPL • DSL line sharing • Significant delays in rolling out DSL to the masses • Cable took advantage (networks were “information services” and not subject to the same regulation. • No rate restrictions • Monopoly-like control over markets • Interesting broadband landscape • Markets where a cable provider has acquired a dominant share in the provision of residential broadband, effectively limit the appeal of that market for alternative providers and their platforms (e.g. DSL)
Market Reactions One DSL enabled switch in Allen County Entire county is served by cable broadband via Time Warner Cable (near monopoly) Sequelle Communications Alliance
Market Structure • Urban areas often benefit from high levels of both broadband competition and consumer choice • Urban submarkets can be devoid of choices • Certain rural and isolated markets have local access and strong competition • Neighboring areas have almost no broadband availability • Monopoly control • Commercial or government sponsored broadband options • Market size, market location and public policy play a major role in broadband availability • Distinct Broadband regions are now forming in the U.S.
Data • FCC Form 477 • Facilities-based firms with 250 or more terrestrial broadband lines or wireless broadband channels (in a given state) report basic information about its services and customer base. • Data are collected semi-annually and aggregated to the zip-code level • FCC zip code data for the 48 contiguous U.S. states for June 2004 (n = 26,605) • Excel, GeoDa, ArcGIS and SPSS
Global Moran’s I Global Analysis • The basic idea behind delineating broadband regions is to define a set of contiguous zip codes that share the similar levels of broadband availability and competition • However, we need to know if a pattern of similarity or dissimilarity exists • Spatial Autocorrelation • General descriptive measure that helps determine the interdependence between values of the same variable at different geographic locations (Cliff and Ord, 1981; Griffeth, 1987; Odland, 1988; Bailey and Gatrell, 1995)
Contiguity • First order • Neighbors • Second order • Neighbors of neighbors • Larger neighborhood definitions allow for a more robust evaluation of the spatial trends which may or may not be present in the data • Global Moran’s I: • First Order = 0.6599 • Second Order = 0.5738 • Broadly interpreted, this suggests that similar levels of broadband availability and competition tend to cluster the United States
where: are deviations from the mean 95% confidence interval (p = 0.05) Local Indicators of Spatial Association • Local measures of spatial autocorrelation (Anselin, 1995) identify the possible contributions of each location to the global index. • In other words, the spatial association between the value of the variable in question (at a particular location) and its local neighborhood is quantified.
Broadband Regions High-High (Broadband Core): Where zip codes displaying high levels of broadband availability and competition are surrounded by other zip codes with similar values. These regions correspond to the greatest levels of broadband availability and competition in the United States and are primarily located in urban areas.
Broadband Regions Low-Low (Broadband Periphery): Where zip codes displaying low levels of broadband availability and competition are surrounded by other zip codes with similar values. These regions are largely devoid of broadband options and are primarily located in the most rural and remote areas of the United States
Broadband Regions Low-High (Islands of Inequity): Where zip codes displaying low levels of broadband availability and competition are surrounded by zip codes displaying relatively high values. These locations are typically found adjacent to, or inside of, the Broadband Core zones;
Broadband Regions High-Low (Islands of Availability): Where zip codes displaying high levels of broadband availability and competition are surrounded by zip codes displaying relatively low levels. These locations are scattered throughout the U.S., with many of them found on the outskirts of MSAs or CMSAs
Statistical Breakdown Broadband Core is clearly centered on the major metropolitan regions in the United States – with the overwhelming majority of zip codes in Census defined metropolitan areas
Not only does the BC encompass the vast majority of the Atlanta metropolitan area, there is spillover into smaller adjacent metropolitan and micropolitan areas There is no spillover and all of the BC is contained with the Oklahoma City metropolitan area
Statistical Ecology • Principle Components Analysis (PCA) • Data matrix -> key demographic, socioeconomic, and business indicators for each of the defined broadband regions. • Varimax-rotated solutions, where the objective is to maximize the explained variance while maintaining an orthogonality constraint to ensure that components remain uncorrelated A more complete picture of market structure will be deduced, deepening our understanding of what helps motivate both the rollout of broadband services at the local level and the degree to which market characteristics fuel broadband competition.
Statistical Ecology (BC) • Six significant components were found in the PCA (eigenvalues > 1), explaining approximately 67 percent of the variation.
Statistical Ecology (BP) • Five significant components were found in the PCA (eigenvalues > 1), explaining approximately 56 percent of the variation in the original data
Statistical Ecology (IIn) • Seven significant components were found, explaining 65% of the variation in the original data.
Statistical Ecology (IA) • Five significant components were found, explaining 62% of the variation in the original data
Discussion and Conclusion • First, it is clear that many of the largest urban areas are benefiting from robust levels of broadband competition • exactly what legislators had in mind when drafting the Telecommunication Act of 1996 • never really in question, i.e., the demand for almost any telecommunication service, whether it’s broadband, cellular, or wimax will be greater in urban areas because they have the largest agglomerations of both households and businesses. • Spillover of broadband competition to smaller communities that surround the largest urban areas is a relatively notable change
Discussion and Conclusion • Second, It is becoming increasingly clear that the Broadband Periphery, those areas with limited levels of competition, are beginning to display a certain amount of geographic inertia. • Although most areas in the United States, even those classified as rural, have some type of broadband available, the actual number of providers and platforms available are very slow to change. • Appalachia and the Upper Great Plains • Clear that certain areas are making efforts to remedy their status. As noted previously, Washington County, Ohio is an example of a peripheral region that launched its own broadband company to bring access to the region
Discussion and Conclusion • Many smaller communities located in peripheral regions have done the same thing: • Ashland, Oregon, Glasgow, Kentucky, Klamath County, Oregon, and Muscatine, Iowa (NRC, 2002). • This suggests that local policy directives and municipal efforts in securing broadband access can actually supersede the slower free-market mechanisms framed by the TA96 • Third, Islands of Inequity are a bit perplexing. • Much of this region is located on the outskirts of major metropolitan areas in suburban and exurban communities • It’s likely that these regions will be served by several broadband providers, in the near future(technological hurdles).
Discussion and Conclusion • However, the Islands of Inequity located in established urban areas offer a different set of challenges. • relatively high populations of impoverished minorities. • In many cases, these are not particularly attractive markets for broadband providers (Grubesic and Murray, 2004). • Moreover, because these areas are surrounded by regions with relatively good access to broadband, there is very little incentive for municipal governments to intervene with additional policies or subsidies to encourage broadband deployment. • As a result, these urban Islands of Inequity are simultaneously victimized by the deregulated telecommunications market created by the TA96 and rendered powerless by their local governments which are not promoting an equitable distribution of broadband services.