Download
1 / 22
230 likes | 339 Views
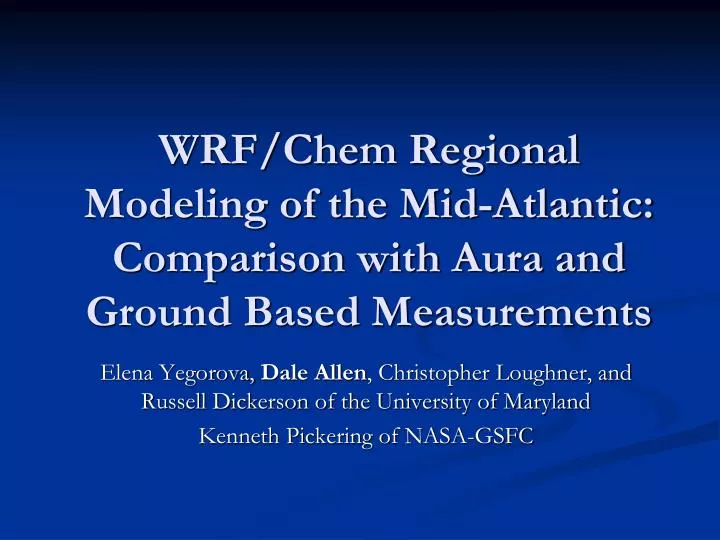
WRF/Chem Regional Modeling of the Mid-Atlantic: Comparison with Aura and Ground Based Measurements. Elena Yegorova, Dale Allen , Christopher Loughner, and Russell Dickerson of the University of Maryland Kenneth Pickering of NASA-GSFC. Goals of today’s talk.

E N D
WRF/Chem Regional Modeling of the Mid-Atlantic: Comparison with Aura and Ground Based Measurements Elena Yegorova, Dale Allen, Christopher Loughner, and Russell Dickerson of the University of Maryland Kenneth Pickering of NASA-GSFC
Goals of today’s talk • Analyze an east coast of the United States air pollution event using surface observations (AIRNOW 8-hr maximum ozone amounts), satellite retrievals from OMI and TES, and output from a regional atmospheric chemistry model. • Obtain insight into the capabilities of OMI and TES to detect air pollution on the urban scale. • What event? • July 9-11, 2007 pollution event • What model? • On-line Weather Research and Forecasting model with integrated chemistry (WRF-Chem).
Air quality on July 9, 2007 was Code Red (very bad) in the Mid-Atlantic. 8-hr max O3 of 131 ppbv within Baltimore NAA Baltimore, MD visibility during a clear day Baltimore, MD visibility At 6:45 PM July 9, 2007 Images obtained from the U.S. Air Quality Smog Blog (http://alg.umbc.edu/usaq).
WRF/Chem Configuration • Domain: Eastern U.S. • 12 km hor res, 23 vertical layers • MOZART-4 chemical IC/BC • Meteorology driven by the North American Regional Reanalysis (NARR) model with grid nudging (FDDA). • Emissions: • Points sources from July 2007 CEMS data. • Area sources are projected 2009 emissions used in SIP modeling. Grown from 2002 U.S. inventory. • Emissions processed using SMOKE modeling system • M3DRY dry dep scheme implemented • No lightning NOx or stratospheric chemistry
TES and OMI Products • TES: • Version 4 Level 2 Global Survey and Step & Stare Special Observations (Nadir) • OMI/MLS global, daily tropospheric column product: • OMI total column minus stratospheric column from the Microwave Limb Sounder (MLS) (Lapse rate tropopause product of M.Schoeberl). • OMI Level-2 Ozone Profile Data, global, daily (Xiong Liu)
Build-up to July 9, 2007 Air Pollution Episode: Comparison to ground stations • WRF/Chem simulation: 00 UT July 6, 2007 – 00 UT July 12, 2007 • Good agreement along the I-95 corridor. • High-bias present over the Appalachian Range (northern GA to se VA) • Note: After these simulations were made, a patch was added to M3DRY. This patch increases • deposition over water.
WRF/Chem and Beltsville, MD Ozonesonde July 9,2007 18 UTC (1 pm EST)
TES OMI • TES and OMI have the greatest sensitivity in the 850 mb – 600 mb range • Capable of detecting pollution in the lower troposphere, but with greatly diminishing sensitivity below 800 mb
TES and OMI Tropospheric Column Ozone – 20070709 18UTC • TES measured elevated Tropospheric Column Ozone (TCO) in the pollutant outflow region
Origin of the Elevated Ozone Air Mass • HYSPLIT 72 hr back trajectories from TES profiles with high TCO values: starting at 2km (left), 4km (center), 7km (right) • At all levels air mass passed over the Great Lakes and Ohio River Valley within the previous 48 hours.
On July 7, 8, and 9, 2007 surface 8-hr max O3 was above 70 ppb in the Great Lakes Region and Ohio River Valley
Analyzed TES TCO in the grid box [75W to 69W], [30N to 38N] for: All 2005-2008 Step and Stare Observations June-August 2005-2008 Global Observations How does TES-retrieved TOC during this event compare to climatology?
TES (Step and Stare) TCO Climatology (2005-2008) Boxes show 25th and 75th%. Whiskers show 5th and 95th%. • TES measured TCO values ≥ 60 DU in the pollutant outflow region are at the 95th percentile of all Special Observation measurements made in July (2005-2008). Note: Boxes show 25th and 75th%. Whiskers show 5th and 95th%.
TES (Global) TCO Climatology (June, July, August 2005-2008) • TES measured TCO values are ≥ 60 DU in the pollutant outflow region and are at ≈ the 75th percentile of all Level 2 measurements made in June-August (2005-2008).
TES, OMI, WRF/Chem (raw), MOZART-4 (raw) Tropospheric Column Ozone
TES, OMI, WRF/Chem, MOZART-4 Tropospheric Column Ozone Time series along TES track • Results shown before applying TES and OMI averaging kernels • TES measured the highest TCO values; OMI/MLS measured the lowest TCO values
TCO 600 hPa < P < 800 hPa
Conclusions • Spatial pattern of July 9-11 air quality event is captured by WRF/Chem. • For this particular TES flight track, TES tropospheric O3 column > WRF/Chem column; OMI >MOZART4 > OMI/MLS column • Average TES bias: 8 DU for Tropospheric Column Ozone • TES detected elevated ozone off the coast, in agreement with WRF/Chem and MOZART-4 models, illustrating continental outflow of pollution. Polluted air mass originated over Great Lakes and Ohio River Valley within previous 48 hours. • The high TES TCO values detected in this episode are at the 75th (95th) percentile of all July Global Survey (Special Observations) data. *Acknowledgements: Gregory Osterman, Mark Schoeberl, Dylan Jones, George Grell, Steven Peckham, Xiong Liu, Louisa Emmons.
This study is a work in progress. Possible next steps include: • Analyze sensitivity of results to domain through a nested 36/12 km simulation of event (TES retrieval on edge of 12-km domain) • Investigate sensitivity of WRF-Chem calculated O3 to convective parameterization, deposition module, chemical mechanism, and boundary conditions. • Compare WRF/Chem to Canadian flight data (Border Air Quality and Meteorology Study [BAQMS]) on July 8, 2008 around Lake St. Clair • Compare WRF-calc and satellite-retrieved HCHO/NO2 tropospheric column ratios for insight into chemical regime • Compare WRF-calc PM2.5 to measurements • Compare with additional TES retrievals.