Download
1 / 25
250 likes | 326 Views
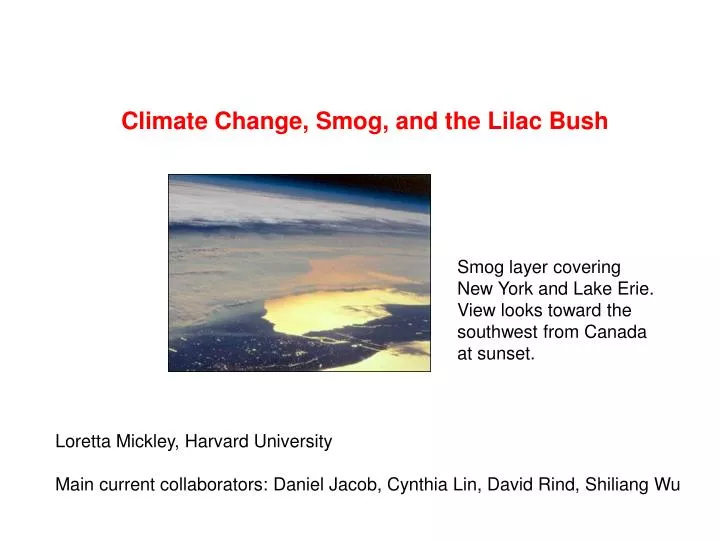
Climate Change, Smog, and the Lilac Bush. Smog layer covering New York and Lake Erie. View looks toward the southwest from Canada at sunset. Loretta Mickley, Harvard University Main current collaborators: Daniel Jacob, Cynthia Lin, David Rind, Shiliang Wu. CO 2 , methane,.

E N D
Climate Change, Smog, and the Lilac Bush Smog layer covering New York and Lake Erie. View looks toward the southwest from Canada at sunset. Loretta Mickley, Harvard University Main current collaborators: Daniel Jacob, Cynthia Lin, David Rind, Shiliang Wu
CO2, methane, . . . Greenhouse gases act as a kind of blanket to slow the escape of heat from earth. heat visible light earth ice Without any greenhouse gases, the earth would be very cold, around 0 oF
Ice core data tell us that concentrations of greenhouse gases have increased over the last several hundred years. Main source of CO2: fossil fuel combustion methane CO2 Some sources of methane: wetlands, animals, natural gas leaks, landfills
Data from temperature proxies show that the earth has warmed ~ 1-2 oF since 1000 AD. Models indicate that CO2 is the likely reason. thermometer data Hockey stick plot proxy data Historical records Large uncertainty far back in time! Mann et al., 1999
In the last 25 years, temperature changes have varied greatly over the globe. Large increases in temperature At high latitudes, higher temperatures melt ice, less sunlight gets reflected back to space, and temperatures climb still higher. insufficient data
Models of the earth-atmosphere system tell us that temperatures are likely to increase over the next 100 years. Predictions depend on scenario of future energy use and on the model used. Globally averaged temperatures predicted to increase 1-5 o C, or 2-10 oF. But increases could vary a lot from region to region.
Observations suggest that climate may have changed in recent decades in New England. ice out earlier? ice in later? no ice Lilacs in New England are blooming about 1 day earlier per decade. Ice-in and ice-out dates for lakes show warming trend.
What does climate change have to do with the ozone hole? Is there a connection between smog and climate? CO2, methane, . . . Climate change (a.k.a. global warming): + ozone Ozone hole = loss of ozone over the Antarctic and Arctic: ozone column amounts over Antarctica, October 2001 Air pollution (smog) = bad air at the earth’s surface, damages crops and people’s health. ozone, particulate matter (PM) ozone = O3
GOOD vs. BAD OZONE Ozone profile Ozone layer stratosphere “Natural ozone” Product of O2 + sunlight Absorbs ultraviolet sunlight altitude 9-15 km Smog ozone is formed in the soup of chemicals in the troposphere, some natural and some manmade. Needs sunlight. Precursors: NOx, volatile organic compounds (cars, power plants, vegetation. . .) troposphere smog ~10 ppb ~10 ppm
Number of summer days with ozone levels > 84 ppb, averaged over Northeast Probability of ozone exceedance vs. daily max. temperature 1988, hottest on record Day-to-day weather affects the severity and duration of pollution episodes. Will climate change affect smog? New England days Lin et al. 2001 The probability of having an ozone episode increases with increasing temperature due to faster chemical reactions, increased biogenic emissions, and stagnation.
Stagnation conditions often lead to high ozone days. cold front ozone levels Day 1 Stalled high pressure system, high ozone. Unhealthy for “sensitive people” cold front Day 4 Cold front is beginning to push away smog.
High ozone levels can affect even remote rural areas very hot summer Number of summer days with ozone levels > 84 ppb, averaged over 8 hours, at the top of Mt. Washington. Nighttime trajectories of air masses that correspond to high ozone levels on Mt. Washington 85 ppb High ozone air over New England often comes from Midwest. 80 ppb
Compare present-day model results against observations for validation.For future climate, increase greenhouse gas content of the atmosphere. We used a global climate model to see how changes in future circulation patterns would affect smog. Use equations to describe air motions, transit of sunlight through the atmosphere, and chemical reactions. Grid structure of global climate model Timeline 1950 spin-up (ocean adjusts) 2000 increasing greenhouse gas 2050
model global mean temperatures 2045-2052 +2o C Temp change { spin up 1995-2002 We implemented two tracers of pollution – carbon monoxide (CO) and black carbon particles (soot) – into the model. We applied manmade sources and simple sinks to the CO and soot. CO, soot ~ proxies of ozone Timeline 1950 spin-up (ocean adjusts) 2000 increasing greenhouse gases 2050
midwest northeast California southeast Our approach: Look at daily mean concentrations averaged over specific regions for two 8-year intervals (1995-2002) and (2045-2052). Histogram of CO concentrations averaged over Northeast for 1995-2002 summers (July-Aug) Cumulative probability plotshows the percentage of points below a certain concentration.
Cumulative probability plots for surface both tracers show significantly higher extremes in 2050s compared to present-day. July - August Increased concentrations of these pollutants at extremes indicate more severe pollution events in the future. 2050s We found that the frequency of summertime cold fronts in the future decreased by 10-20% across the Midwest and Northeast. That meant that pollution episodes lasted longer and pollutants could accumulate. 1990s
1. Climate change could cause a slowdown in the number of cold fronts coming through in future summers, which would lengthen smog episodes. weak winds low pressure system Evolution of a smog episode over 6 days in summer (model output) cold front from Canada 100 x mg/m3
Traditional approach for calculating the full effect of climate change on air quality (smog) is very time-consuming. met fields Global model Regional climate model Work involves an array of models to go from global scale to regional scale. met fields downscaled met Chemical transport model Regional chemistry model chem fields FUTURE AIR QUALITY
Observed probability of ozone exceedance vs. daily max. temperature Future temperature change over Northeast 1900-2100, calculated by many global climate models We devise a simpler method to look at effects of climate on smog. Idea: Use probability of ozone exceedance + daily GCM maximum temperatures to predict number of exceedance days each summer in future. Step 1. find probability for each model day’s maximum temperature Step 2. likely number of exceedances = sum of probabilities for each summer 1. 2. + Lin et al. 2001 = future smog episodes
New approach for calculating the effect of climate change on air quality is very quick! met fields Global model Regional climate model Global model met fields daily max temperature downscaled met Chemical transport model Regional chemistry model Statistically downscale temperatures and apply ozone probabilities chem fields FUTURE AIR QUALITY
1988, hottest on record 2. Higher future temperatures could increase the number of bad air days over the Northeast by a factor of 2-6, depending on what energy paths we follow. Calculated future smog days Plots show number of summer days with ozone levels > 84 ppb, averaged over Northeast Observed smog days Assumptions, caveats: for these calculations, we assumed that the emissions of ozone precursors remain constant over time, but the emissions of greenhouse gases like carbon dioxide increase according to different scenarios.
SMOG (excerpts from T’s poem) . . . The smell of too much ozone was like leaves smoldering in another season, in the gutters. . . . A pressure rose then in the air and acquired direction: behind us and above, the air moved and cleaned until a bracing exhalation of clear air from the interior disturbed the water’s rim and purged the atmosphere . . . Many thanks to T. Wilson, Bob Engel, and my husband Michael Charney Funding sources: NASA, EPA, NOAA, Bunting Institute
Observations show a ~1.8oF increase in surface temperatures across New England since 1899. Trends in temperature at different sites across the Northeast. Area-weighted annual average temperature across the Northeast since 1900. But it’s important to keep in mind that New England is just a tiny part of the world!
Temperature changes going back 400,000 years Back in time Series of ice ages. Reasons for temperature swings = changes in earth’s orbit or tilt ??, sea ice mechanism ?? Temperature changes are probably amplified by changes in CO2 Sowers and Bender, 1995